April 2025 Global Fertilizer and Petrochemical Market Report
Author : Saman Memarpour
April 2025
Global Fertilizer and Petrochemical Market Report:
Trends, Challenges, and Opportunities
Executive Summary
In April 2025, the global fertilizer and petrochemical markets remained highly volatile, influenced by geopolitical instability, logistical bottlenecks, seasonal agricultural demand, and regulatory pressure, particularly from Europe’s ongoing sustainability mandates.
The
conflict in the Middle East and rising tensions in the Red Sea significantly disrupted maritime logistics. This led to longer shipping times, higher freight costs, and congestion at key ports including Bandar Abbas and Sohar. Insurance premiums for Persian Gulf cargoes doubled, adding to the cost pressure. While these disruptions tightened supply for some products, others like granular urea from Iran remained relatively stable or saw slight FOB price declines.
Meanwhile, the European Union’s Carbon Border Adjustment Mechanism (CBAM) continued reshaping global trade dynamics, increasing the demand for low-emission fertilizers and amplifying regulatory scrutiny on products from Asia, Africa, and the Middle East. As a result, suppliers faced mounting pressure to demonstrate traceability and sustainability in their production chains.
The fertilizer price landscape in April showed considerable divergence:
- Sulfur and sulfuric acid posted sharp price gains, fueled by strong Chinese demand and freight-related disruptions from Iran and the Gulf.
- Phosphates (DAP) and NPK 15-15-15 saw moderate price increases, supported by seasonal procurement from India and West Africa and export controls from China.
- Ammonia exhibited slight declines in Middle East FOB values due to oversupply, though prices in Asia remained firm on consistent demand.
- Granular urea presented mixed trends: while Iran’s FOB prices slipped slightly (e.g., MIS sold at 337.20 USD/MT FOB), Oman and UAE prices strengthened on Indian tenders and supply tightening. In Brazil, CFR prices softened mildly on cautious buying and accumulated inventory.
Looking ahead, China’s expected export return, tentatively scheduled for mid to late May, may inject downward pressure into urea prices. However, the anticipated export quota system (possibly capping volumes at 3.5–4 million tons) and delays due to CIQ inspections mean that the global market may remain tight until late Q2.
This report delivers a comprehensive overview of these developments, providing stakeholders with critical insights into evolving price dynamics, freight logistics, trade flows, and emerging regional opportunities to support procurement planning and strategic risk mitigation for Q2 2025.
March vs April 2025 Price Comparison
| Product | March 2025 Avg. Price | April 2025 Avg. Price | Price Change | Trend |
|---|---|---|---|---|
| Granular Urea (FOB Iran) | 342-350 USD/MT | 331-350 USD/MT | -10 to 0 USD/MT | ⚖️ Stable |
| Granular Urea (FOB Oman) | 380-385 USD/MT | 400-405 USD/MT | +20 USD/MT | 📈 Rising |
| Ammonia (FOB Middle East) | 320-325 USD/MT | 310-320 USD/MT | -5 to -10 USD/MT | 📉 Slight Decrease |
| Sulfur (FOB Iran) | 130-135 USD/MT | 150-160 USD/MT | +20 to +25 USD/MT | 📈 Sharp Increase |
| Sulfuric Acid (FOB Middle East) | 55-60 USD/MT | 70-75 USD/MT | +15 USD/MT | 📈 Sharp Increase |
| DAP (CFR India) | 580-590 USD/MT | 595-610 USD/MT | +15 to +20 USD/MT | 📈 Slight Increase |
| NPK 15-15-15 (CFR West Africa) | 460-470 USD/MT | 470-480 USD/MT | +10 to +15 USD/MT | 📈 Moderate Increase |
Note: Prices are average ranges based on Argus, Profercy, ICIS, and other April 2025 market sources.
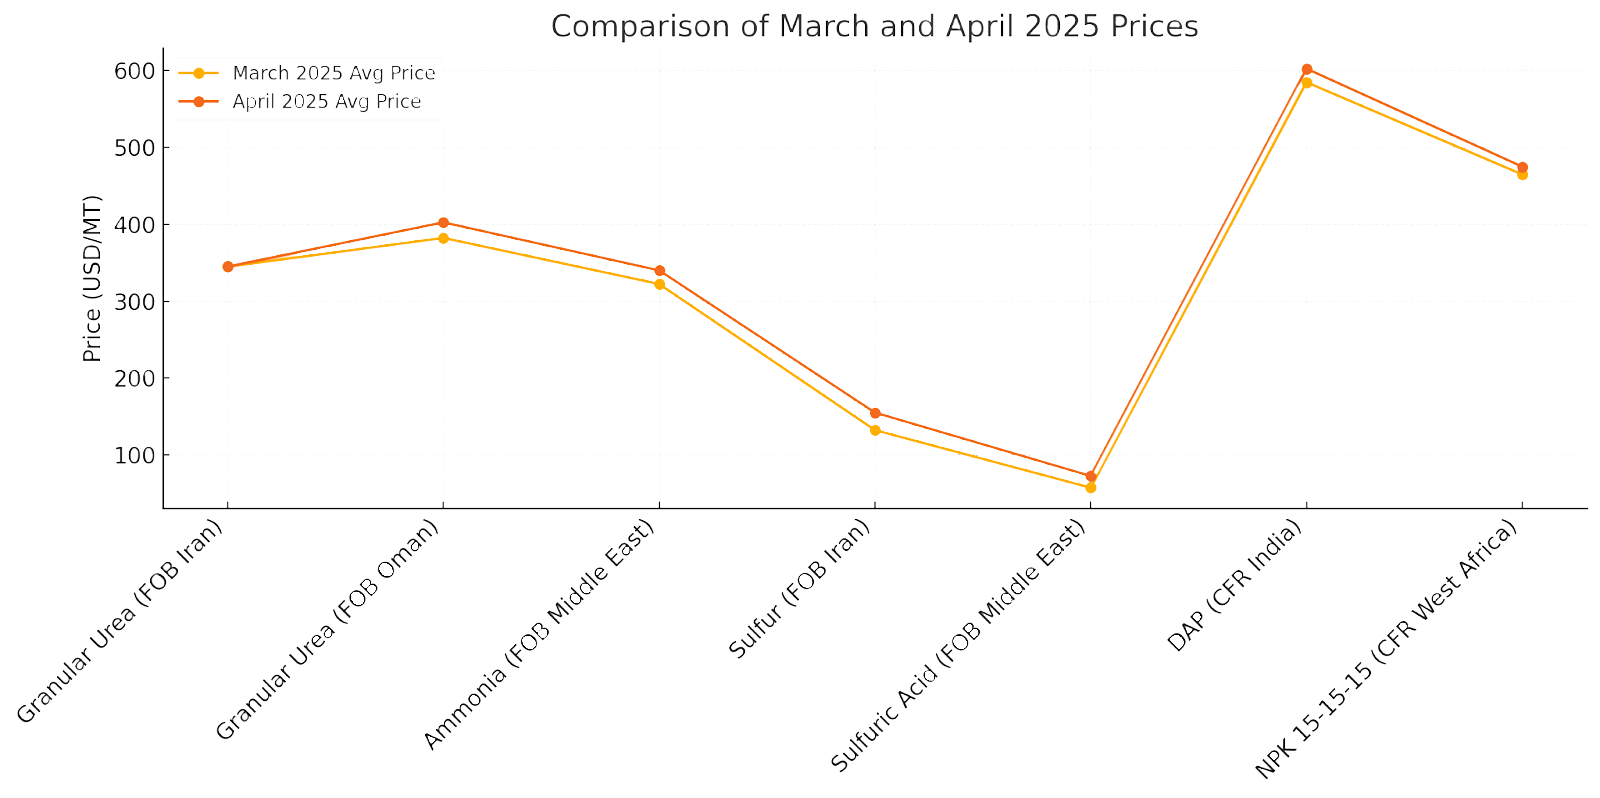
Price Movements March vs April 2025
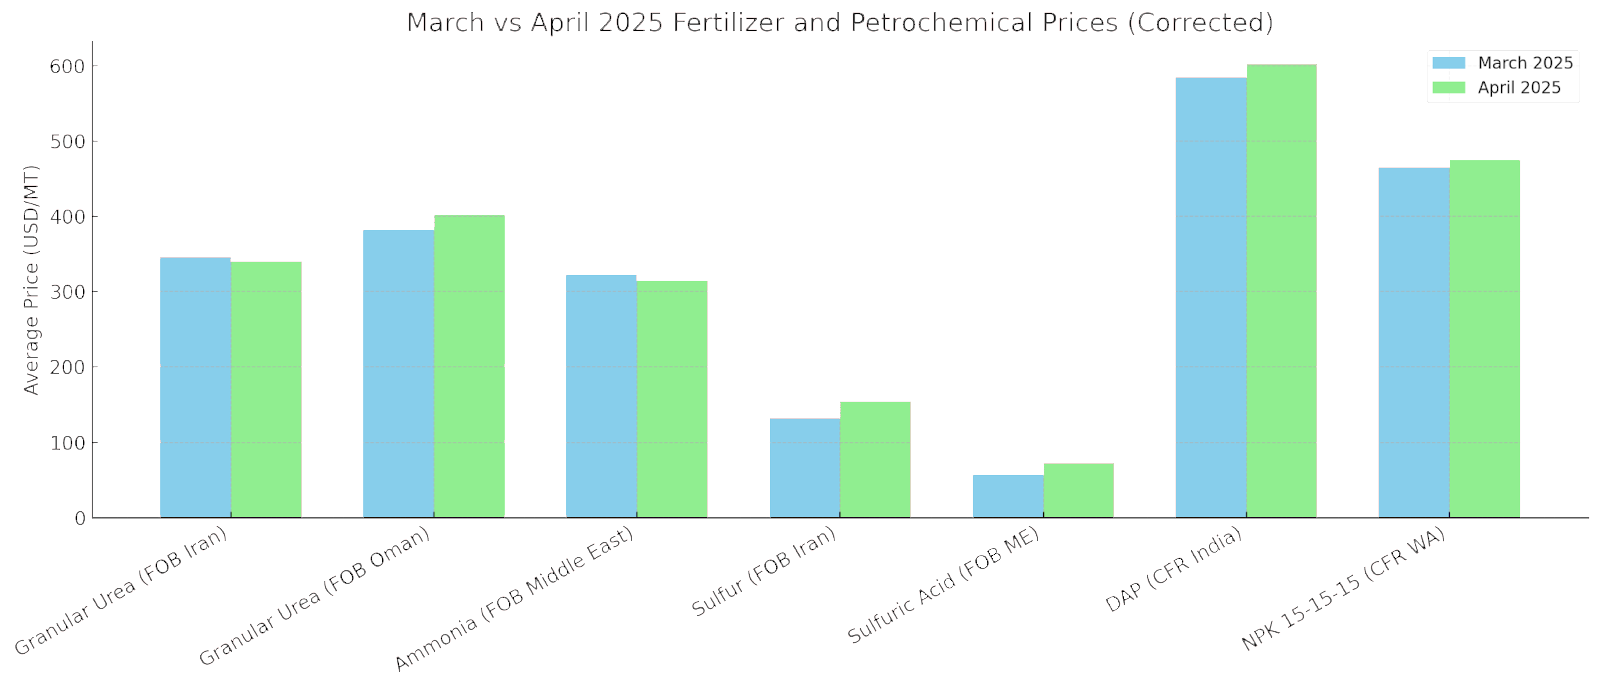
Sources: Verified market data from Argus, Profercy, ICIS, and Armaiti MEX, as of April 30, 2025.
Nitrogen Market Overview
Urea Market Trends
Urea prices in April 2025 exhibited mixed performance across global markets, influenced by geopolitical tensions, freight disruptions, and proactive procurement strategies. While Middle Eastern supply routes faced ongoing instability, the impact on regional FOB prices varied by origin.
Key Drivers:
- Middle East Conflict & Port Congestion:
Heightened maritime security risks in the Red Sea, especially around the Bab-el-Mandeb strait, and delays at Bandar Abbas and Sohar caused freight rate increases. However, FOB Iran prices remained relatively stable or slightly weaker, as port bottlenecks constrained export volume growth. - India’s Strategic Tendering:
India issued an early tender to secure granular urea for the upcoming kharif season, tightening availability in the Middle East and Southeast Asia. This buoyed FOB Oman and UAE prices but had a limited effect on Iranian exports, which were already logistically constrained. - Iranian Production & Export Challenges:
Iranian plants continued production recovery post-winter, but inland congestion and vessel delays prevented full-scale export resumption. As a result, FOB Bandar Abbas prices stayed capped, ranging between 331 and 350 USD/MT.
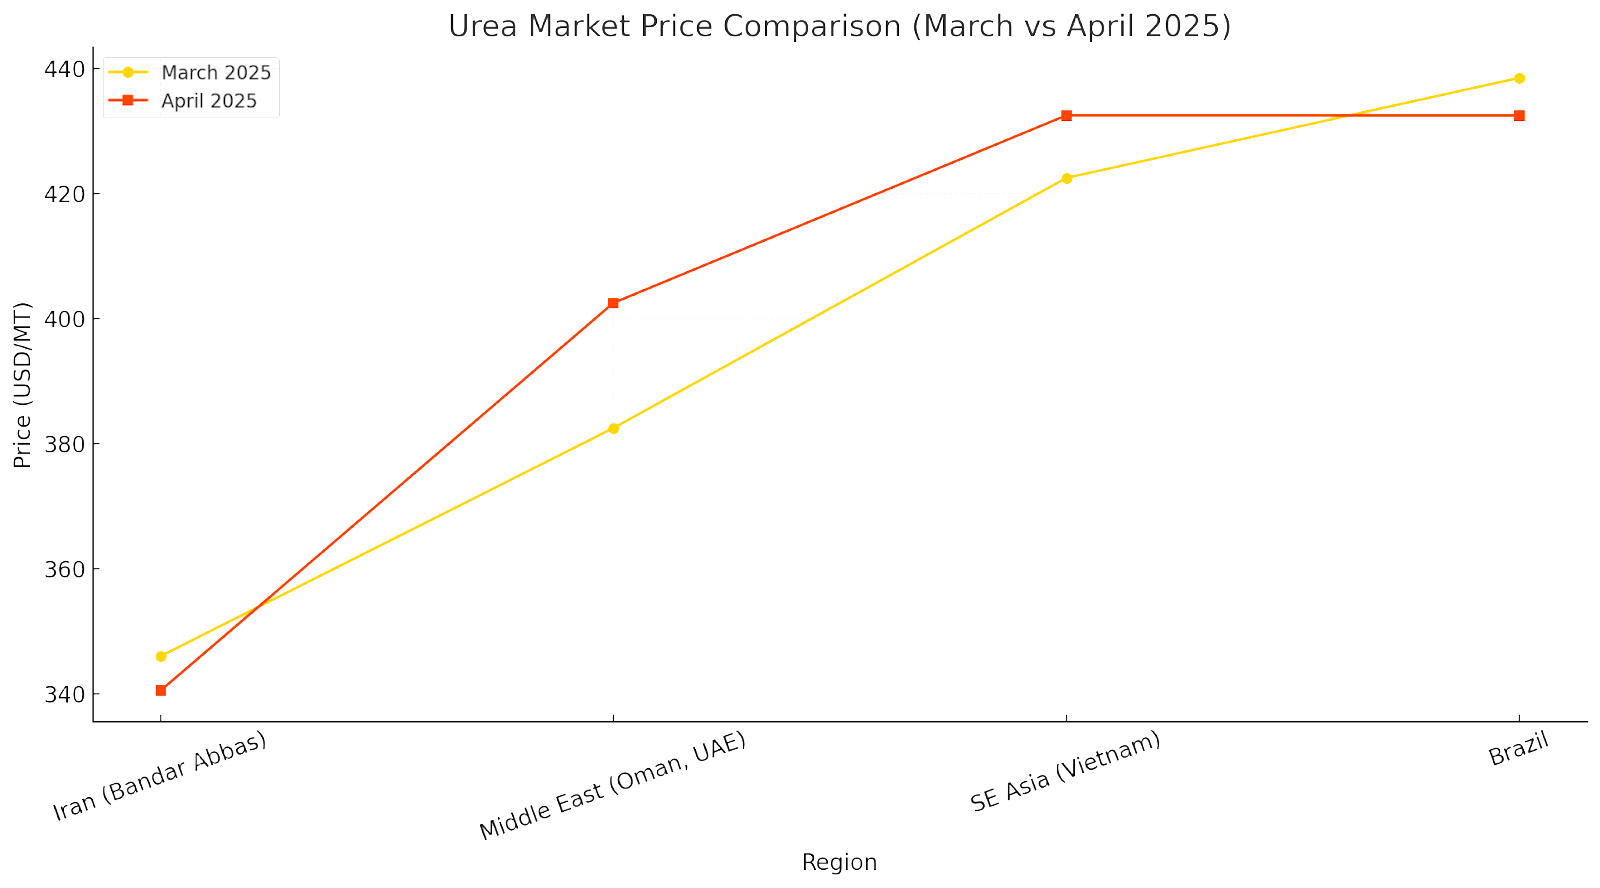
Regional Highlights:
| Region | March 2025 Avg Price | April 2025 Avg. Price | Change | Notes |
|---|---|---|---|---|
| Iran (Bandar Abbas) | 342–350 USD/MT | 331–350 USD/MT | ▼ -10 USD | Congestion offsetting export momentum |
| Oman & UAE | 380–385 USD/MT | 400–405 USD/MT | ▲ +20 USD | Strong regional demand; Indian and SEA buyers are active |
| Vietnam (CFR) | 420–425 USD/MT | 430–435 USD/MT | ▲ +10 USD | Tightened supply from China and India’s buying accelerated prices |
| Brazil (CFR) | 437–440 USD/MT | 430–435 USD/MT | ▼ -5 USD | Importers delayed purchases; softened demand amid early stock buildup |
- Iran (Bandar Abbas): Prices slightly declined from 342–350 USD/MT in March to 331–350 USD/MT in April (FOB). This minor drop was due to freight volatility, port congestion, and delayed vessel loadings despite steady production recovery. Market sentiment remained cautious, and price support was fragile.
- Oman & UAE: Prices rose from an average of 385 USD/MT in March to approximately 402–405 USD/MT in April. This increase reflected tight regional supply, strong Indian demand, and diverted trade flows from other Middle Eastern ports under strain.
- Vietnam (SE Asia CFR): Prices increased from 420 USD/MT in March to about 432–435 USD/MT in April. The rise was driven by India’s early tender, limited Chinese export availability, and increased seasonal demand in Southeast Asia.
- Brazil (CFR): Prices were stable to slightly lower, averaging around
430–435 USD/MT in April, down from
437–440 USD/MT in late March. This reflected
slow spot activity,
high inventories, and buyers awaiting clearer price direction.
Ammonia Market Trends
Ammonia prices experienced a modest downward correction in April 2025, particularly in the Middle East and Black Sea regions, due to ample supply, sluggish industrial demand, and limited spot trade activity.

Key Observations:
- Middle East Oversupply:
Ammonia prices in the Middle East experienced mild downward pressure in April 2025, declining from 320 USD/MT to 315 USD/MT FOB, primarily due to increased availability from major producers like Saudi Arabia and Qatar. These countries expanded exports after completing seasonal domestic demand cycles, contributing to oversupply and weakening spot prices across Gulf terminals. - Stable to Firm Asian Demand:
While upstream FOB prices decreased, Asia’s CFR ammonia market remained stable at 395 USD/MT, underpinned by steady industrial demand in India, Thailand, and South Korea. Fertilizer producers and chemical manufacturers maintained regular import volumes, helping prevent further regional price softening. - Black Sea Constraints:
In the Black Sea, FOB ammonia prices dropped slightly from 290 USD/MT in March to 283 USD/MT in April, due to limited buying interest from Mediterranean markets and ongoing freight inefficiencies. Sanctions and complex shipping routes restricted trade flows, further complicating price support in the region. - Freight Influence:
Freight volatility—primarily outbound from the Middle East—contributed to pricing dislocations between FOB origins and CFR destinations. Some Asian buyers began seeking contractual security to hedge against future freight-driven cost spikes.
Regional Highlights:
- Middle East (FOB):
Prices slipped slightly from 320 USD/MT in March to 315 USD/MT in April, as increased export supply from key producers like Saudi Arabia and Qatar added pressure on spot values. While production remained stable, reduced buying from South Asia and some reallocation of cargoes to Europe added downward momentum. Freight congestion through the Red Sea also complicated FOB competitiveness. - Black Sea (FOB):
Ammonia prices in the Black Sea dropped from 290 USD/MT to 282.5 USD/MT. The market faced subdued demand from Mediterranean and Southern European buyers and lingering logistical inefficiencies from ongoing regional instability and port restrictions. Ukrainian and Russian-origin ammonia shipments continued under constraints, limiting active trade despite available capacity. - Asia (CFR):
Prices remained firm at 395 USD/MT, unchanged from March. Stable demand from fertilizer and industrial users in India, Indonesia, and Thailand, combined with longer-term procurement contracts, helped insulate the region from FOB fluctuations. Due to rising freight risk and tighter shipping availability, some buyers prioritized secure cargo flow over price flexibility.
Phosphate and Potash Markets
Phosphate Market Trends: Rising due to Supply Constraints and Seasonal Demand
The global phosphate market exhibited renewed upward momentum in April 2025, with prices increasing across key supply and demand corridors. The price recovery was primarily supported by tight supply conditions from China, strong seasonal demand in India and Southeast Asia, and logistical challenges impacting freight costs.
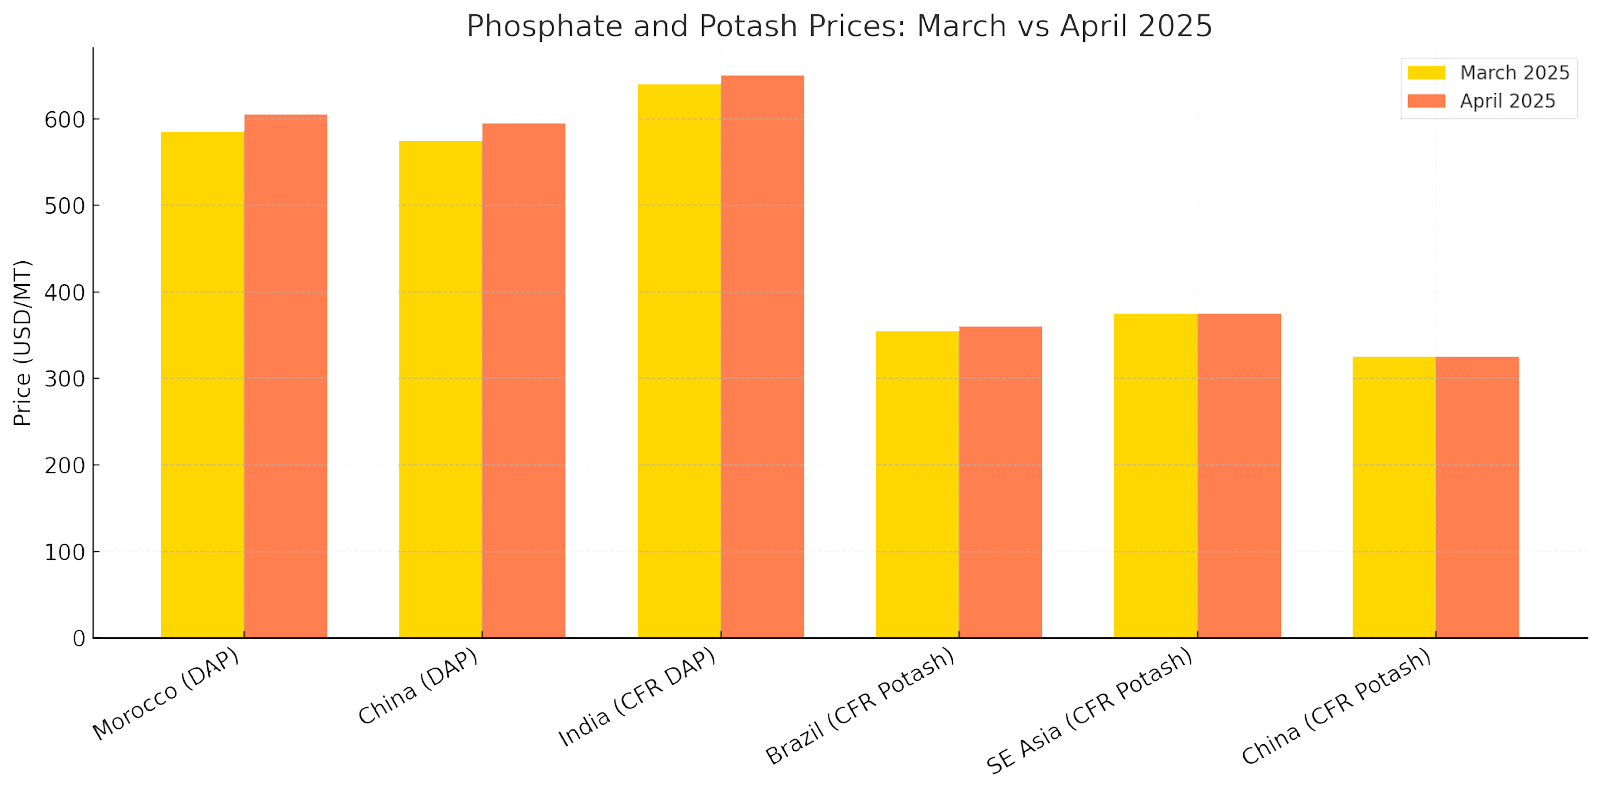
| Region | Product | March Price (USD/MT) | April Price (USD/MT) | Change |
|---|---|---|---|---|
| Morocco | DAP | 585 | 605 | +20 |
| China | DAP | 575 | 595 | +20 |
| India (CFR) | DAP | 640 | 650 | +10 |
| Brazil (CFR) | Potash | 355 | 360 | +5 |
| Southeast Asia (CFR) | Potash | 375 | 375 | No change |
| China (CFR) | Potash | 325 | 325 | No change |
Key Drivers:
- Chinese Export Controls:
China continued enforcing strict controls on phosphate fertilizer exports in April as part of its strategic reserve and domestic supply security policy. This policy limited the number of export licenses, curbing FOB availability, particularly for DAP and MAP, out of key ports such as Qinzhou and Fangcheng. This artificial restriction in global supply supported a sustained increase in international FOB prices, particularly in Asia and Africa. - Indian Procurement Surge:
India, the world’s largest importer of Diammonium Phosphate (DAP), accelerated its purchases in April to prepare for the upcoming Kharif cropping season, which begins in June. Government subsidies and a relatively favorable monsoon forecast encouraged bulk buying by Indian state-owned and private importers. As a result, DAP prices rose to 650 USD/MT CFR India, up from 635–645 USD/MT in March, and deals closed quickly due to competition among buyers. - Southeast Asia Demand Growth:
Countries such as Vietnam, Thailand, and the Philippines increased purchases of phosphate and compound fertilizers, seeking to lock in supply ahead of monsoon-related logistical uncertainties. This added regional pressure on availability and prices. - Global Freight Adjustments:
Red Sea maritime disruptions continued to affect global shipping lanes, forcing many cargoes to reroute around the Cape of Good Hope. This led to longer transit times, increased bunker costs, and higher insurance premiums, particularly for cargoes destined for South Asia and East Africa. These increases directly affected CFR prices, compounding FOB market firmness.
DAP Price Comparison Table:
| Region | March Price (USD/MT) | April Price (USD/MT) | Monthly Change |
|---|---|---|---|
| Morocco (FOB) | 580 – 590 | 600 – 610 | +20 USD |
| China (FOB) | 570 – 580 | 590 – 600 | +20 USD |
| India (CFR) | 635 – 645 | 650 | +5 to +15 USD |
Potash Market Trends: Stabilization with Strategic Contracts
In April 2025, the global potash market displayed clear signs of stabilization, following a period of price fluctuations earlier in the year. The market was supported by long-term supply contracts from major global producers—Canada (Nutrien), Belarus (Belaruskali), and Russia (Uralkali)—which dampened spot market volatility and ensured steady deliveries to key import regions.
Key Observations:
- Brazilian Market Stabilization:
Potash prices in Brazil (CFR) rose slightly to 350–360 USD/MT, reflecting stable demand driven by the country’s soy and corn planting activities. Despite seasonal demand, upside potential was limited due to ample supply from Russia and Canada. Some traders noted higher inventory levels in key ports like Santos and Paranaguá.
Asia Holding Steady:
Potash demand in Southeast Asia and China remained flat throughout April. Buyers had largely secured volumes in Q1, and there was little urgency to re-enter the market due to well-covered inventories. Prices remained stable at:
- 370–380 USD/MT CFR in Southeast Asia
- 320–330 USD/MT CFR in China
China-India Contract Benchmarking:
Discussions around a benchmark contract for India’s 2025-2026 potash imports remained under negotiation. Market watchers anticipate price benchmarking closer to 330–340 USD/MT CFR, which may influence spot levels in Q2.
Shift Toward Value-Added Potash Products:
There is a
notable shift toward
granular MOP and
micronutrient-enhanced formulations, particularly in regions focusing on
high-value horticulture and fruit crops. Demand for
specialty potash products, such as SOP (sulfate of potash), is also rising in North Africa and Southeast Asia.
Potash Price Comparison Table:
| Region | March Price (USD/MT) | April Price (USD/MT) | Monthly Change |
|---|---|---|---|
| Brazil (CFR) | 345 – 355 | 350 – 360 | +5 USD |
| SE Asia (CFR) | 370 – 380 | 370 – 380 | Stable |
| China (CFR) | 320 – 330 | 320 – 330 | Stable |
Sulfur and Sulfuric Acid
Sulfur Market Trends: Prices Rise on Logistics and Chinese Import Demand
In April 2025, the sulfur market experienced a robust upward trend, marked by supply limitations, rising transportation costs, and a resurgence in demand from key industrial hubs, most notably China. As a vital raw material in the production of phosphate fertilizers (e.g., Single Superphosphate (SSP) and Triple Superphosphate (TSP)), as well as in the manufacturing of sulfuric acid for industrial and agrochemical use, sulfur’s price movement serves as a leading indicator for broader downstream fertilizer cost trends.
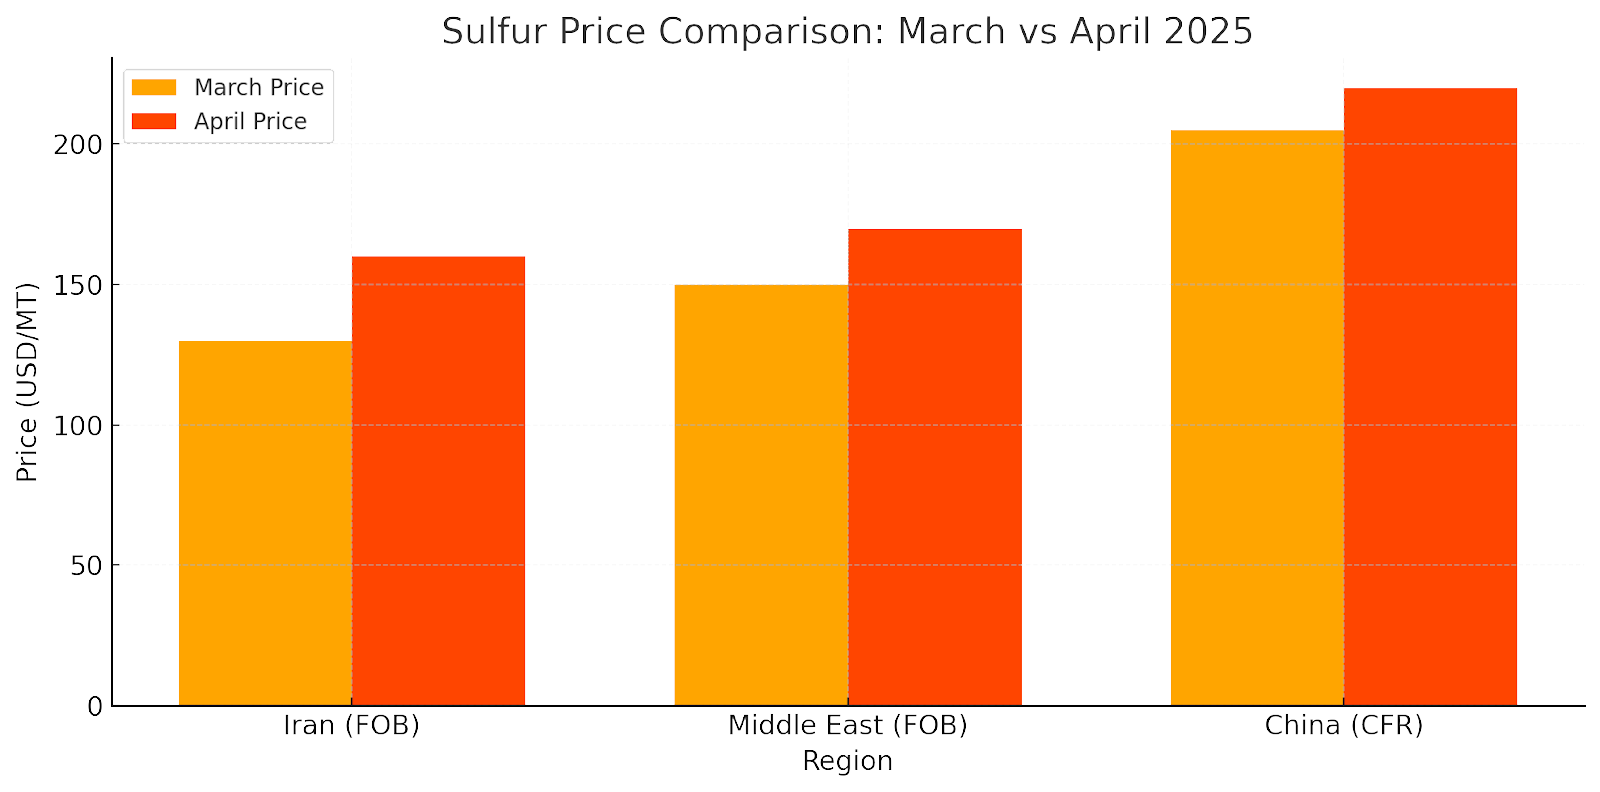
Both prominent lump and granular sulfur exporters, the Middle East and Iran, faced logistical challenges that elevated FOB prices. Due to the ongoing geopolitical risks in the Red Sea and Persian Gulf shipping corridors, exporters struggled with delays at loading terminals, reduced vessel availability, and increased insurance costs. This created a ripple effect throughout sulfur-dependent supply chains, particularly for buyers in Asia and Africa.
Meanwhile, after months of cautious procurement, Chinese importers returned aggressively to the market. The renewed interest was partly driven by increased phosphate fertilizer production, which surged to meet growing domestic agricultural demand before the summer planting season. Buyers in Zhanjiang, Nanjing, and Fangcheng reported heightened activity, pushing CFR China prices to 210–220 USD/MT, up by 10–15 USD/MT month-on-month.
Adding to the upward momentum, supply-side constraints were evident across several key production hubs. Turnaround schedules and output moderation from Gulf producers, including Qatar and the UAE, trimmed the availability of spot cargoes. As a result, FOB Iranian sulfur prices climbed to 150–160 USD/MT, a notable increase from March’s 130–135 USD/MT.
These price movements are not isolated to sulfur markets—they have implications for fertilizer producers, industrial manufacturers, and import-dependent agricultural economies. Higher sulfur input costs can increase production costs for ammonium sulfate, NPK fertilizers, and sulfuric acid derivatives, ultimately impacting end-users and food security in import-reliant countries.
Key Drivers:
- Geopolitical Freight Risks:
Ongoing instability in the Middle East, particularly around the Red Sea and Strait of Hormuz, continued to disrupt maritime logistics. Vessel rerouting around the Cape of Good Hope and congestion at key export terminals, such as Bandar Abbas (Iran) and Ruwais (UAE), increased freight costs and vessel turnaround times. These factors contributed to a 20–30 USD/MT increase in FOB sulfur prices, especially from Iran.
China’s Procurement Activity:
Chinese importers increased sulfur purchases in April to replenish stocks and support phosphate production (notably DAP and TSP). This procurement surge pushed CFR China prices to 210–220 USD/MT, compared to 200–205 USD/MT in March. The increase was robust at southern Chinese ports, which benefited from faster routing from the Middle East.
Tightened Gulf Supply:
Supplies from Ras Laffan (Qatar) and Ruwais (UAE) were lower due to maintenance and prioritization of long-term contracts, which further constrained spot volumes. This shortage raised
FOB Gulf prices by 15–20 USD/MT, affecting downstream Southeast Asia and North Africa buyers. Combined with limited vessel availability, this put sustained upward pressure on market sentiment.
Sulfur Price Comparison Table:
| Region | March Price (USD/MT) | April Price (USD/MT) | Monthly Change |
|---|---|---|---|
| Iran (FOB) | 130 – 135 | 150 – 160 | +20 to +25 USD |
| Middle East (FOB) | 150 – 155 | 165 – 170 | +15 to +20 USD |
| China (CFR) | 200 – 205 | 210 – 220 | +10 to +15 USD |
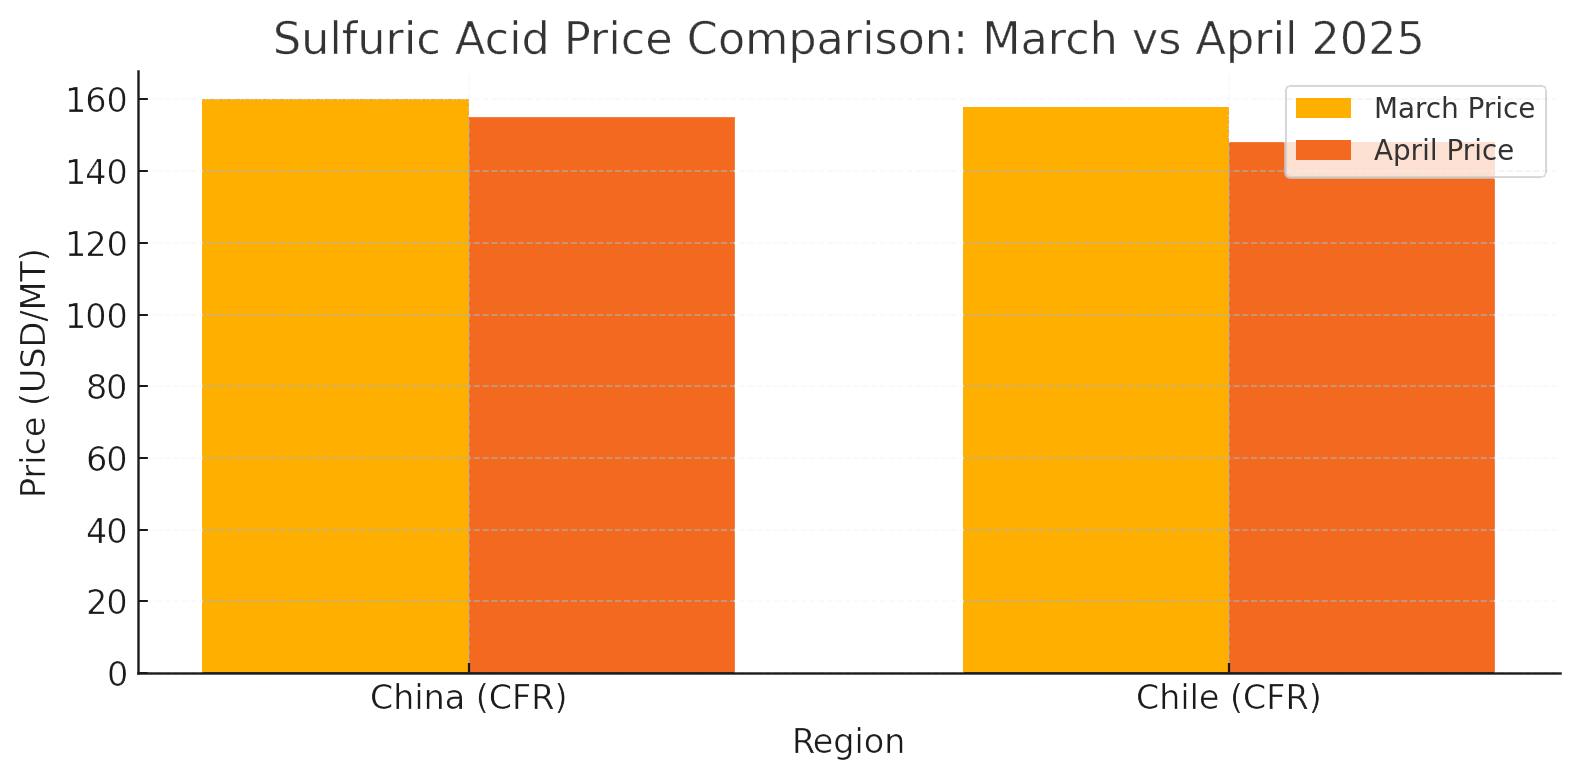
Sulfuric Acid Market Trends:
Pressure from Weak Demand
Unlike the sulfur market, sulfuric acid prices faced downward pressure in April 2025, mainly due to sluggish demand from industrial and mining sectors. The downturn was especially notable in South America, with additional softness seen in China and Southeast Asia, where industrial output failed to absorb existing inventories.
Key Observations:
- Chile Mining Sector Weakness:
Prices dropped to 145–150 USD/MT CFR, compared to 155–160 USD/MT in March. The decline was mainly due to lower sulfuric acid demand from copper and lithium mining operations, which delayed or scaled back procurement amid weaker global commodity prices and stricter environmental scrutiny.
China’s Eastern Port Saturation:
Despite steady fertilizer-sector usage, sulfuric acid prices in China fell to 150–160 USD/MT CFR, from 155–165 in March. Oversupply, particularly at Shandong and Tianjin ports, was driven by a glut of imports and subdued domestic industrial output, including metals processing and battery manufacturing.
Limited Trade Arbitrage:
Freight costs in the Red Sea and Pacific lanes rose by 12–18%, insufficient to counterbalance weak demand. Buyers resisted any upward movement in FOB offers, forcing sellers to cut prices to keep volumes moving.
Southeast Asia Stability:
While not as deeply impacted, markets like
Indonesia and the Philippines also faced mild downward pressure. Sulfuric acid prices here held steady or dipped slightly, supported by palm oil and fertilizer usage.
Sulfuric Acid Price Comparison Table:
| Region | March Price (USD/MT) | April Price (USD/MT) | Monthly Change |
|---|---|---|---|
| China (CFR) | 155 – 165 | 150 – 160 | ▼ 5 USD |
| Chile (CFR) | 155 – 160 | 145 – 150 | ▼ 10 USD |
Freight and Logistics
In April 2025, global fertilizer and petrochemical logistics faced severe disruptions, especially across the Middle East and Indian Ocean corridors. The escalation of conflict in the Red Sea region — including attacks on commercial vessels and heightened naval security measures — drove a sharp rise in freight costs and marine insurance premiums.
Shipping companies rerouted vessels around the Cape of Good Hope, adding 7–14 days to standard transit times from the Middle East to Europe, Africa, and Asia. This directly affected shipment schedules, landed costs, and overall market liquidity for critical commodities such as granular urea, ammonia, sulfur, and NPK fertilizers.
Moreover, the shortage of available vessels (due to increased time at sea and port congestion) led to:
- Freight rates for fertilizer cargoes from the Persian Gulf and Red Sea will increase by 25%—35%.
- Insurance premiums are doubling or even tripling for vessels entering conflict-sensitive zones, especially near the Bab el-Mandeb Strait.
- There has been a shift in buyer behavior, with many buyers preferring FOB terms and arranging their shipping to manage risk exposure.
As a result, CFR (Cost and Freight) prices for many commodities increased due to product costs, freight, and insurance inflation, complicating negotiations and cargo scheduling across key trade routes.
Key Developments:
- Freight Rate Surge:
Freight rates for shipments from the Middle East surged by 25%–30% compared to March 2025. This rise was primarily triggered by intensified geopolitical tensions and maritime security threats in the Red Sea and the Strait of Hormuz. Shipping companies applied war-risk surcharges, fuel price markups, and congestion fees—especially on routes bound for Africa, South Asia, and Europe.
Insurance Premiums Doubled:
Insurance premiums for cargoes departing from Persian Gulf ports doubled in April versus the previous month. The increase was driven by heightened war-risk classifications applied to vessels navigating high-risk corridors, including the Red Sea, Bab el-Mandeb Strait, and parts of the Arabian Sea. These premiums further increased the CFR (cost and freight) values for urea, sulfur, and ammonia cargoes.
Extended Shipping Routes:
Due to security risks and restricted access to the Suez Canal, many shipping lines rerouted vessels around the Cape of Good Hope, especially those destined for Europe and West Africa. This detour added 7 to 14 days to standard delivery times and elevated bunker fuel costs. Cargoes to North and East Africa also faced delays due to rerouting and port congestion in transshipment hubs.
Port Congestions:
Heavy vessel traffic and heightened security protocols led to congestion and delays at major Middle Eastern ports—including Bandar Abbas (Iran), Sohar (Oman), and Jebel Ali (UAE). The average turnaround time increased by 2–4 days, resulting in schedule backlogs, especially for containerized and break-bulk fertilizer shipments.
Buyer Strategies and Risk Mitigation:
Importers across Africa, India, Southeast Asia, and Southern Europe adopted flexible procurement strategies to offset uncertainty:
- Preference for CFR contracts with laycan extensions.
- Increased use of FOB contracts to charter vessels independently and manage freight costs directly.
- Some buyers arranged
buffer stocks and storage near receiving ports to reduce reliance on just-in-time deliveries.
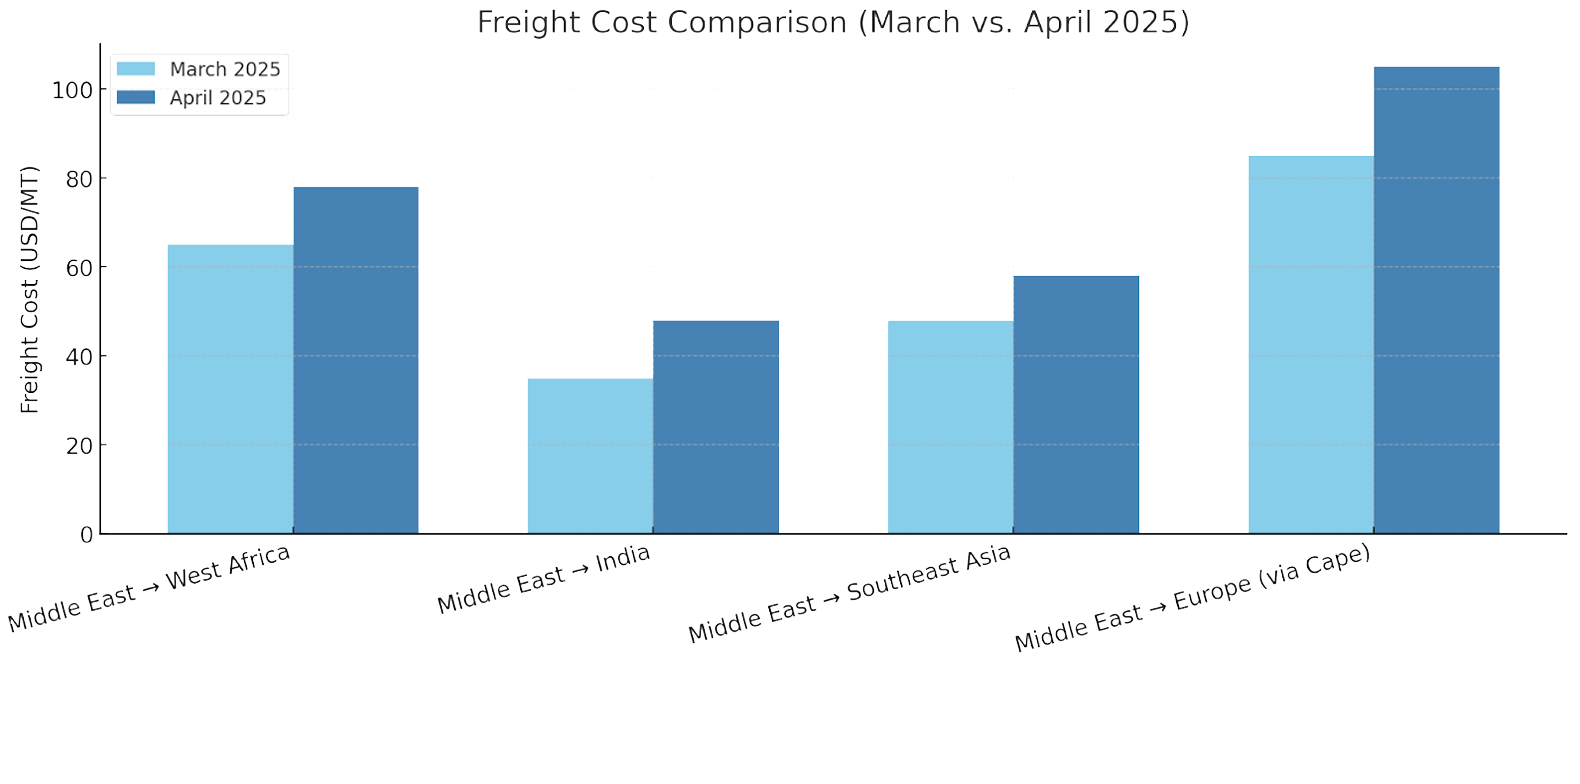
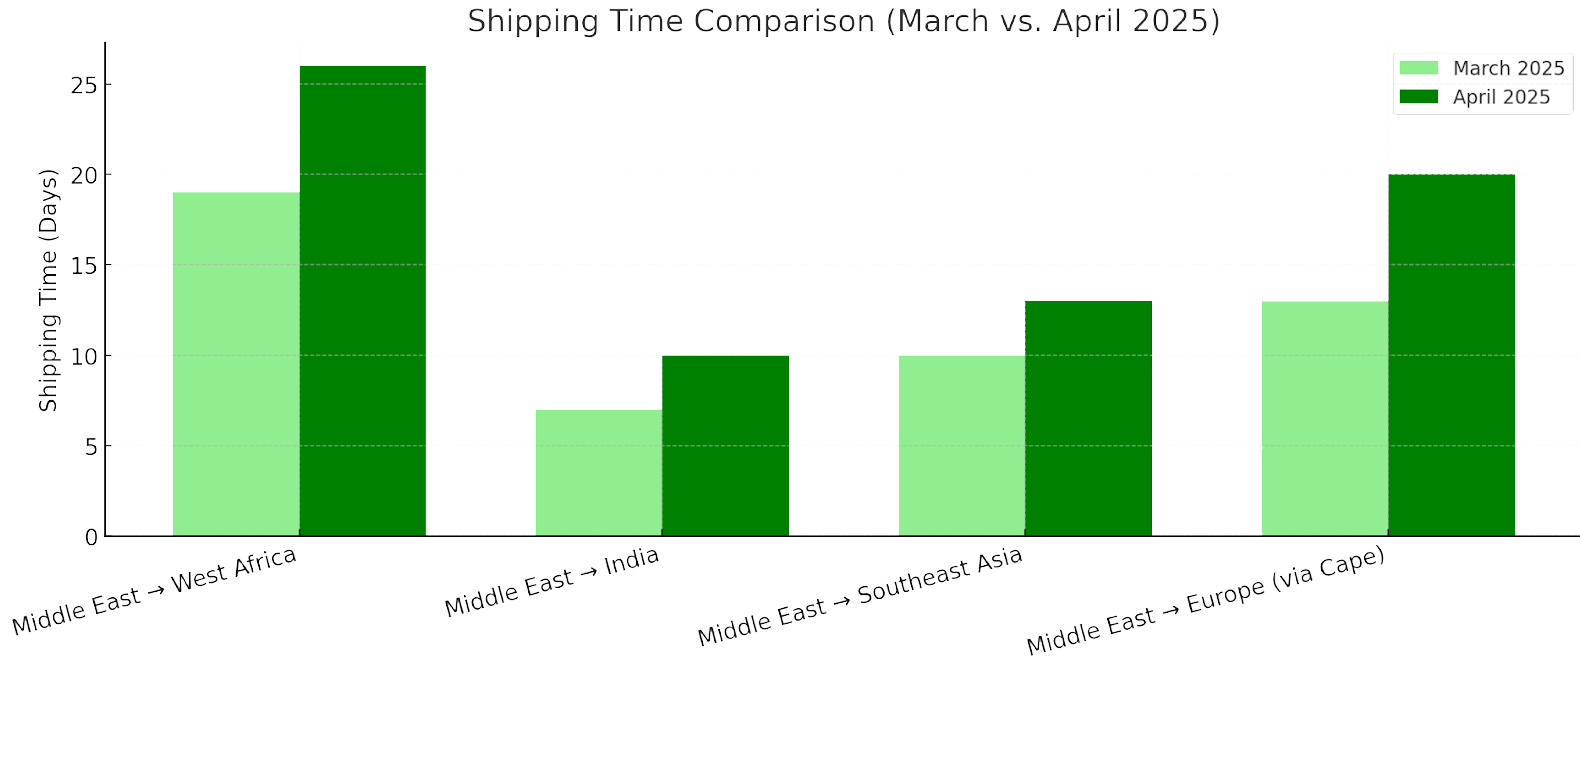
Freight Cost and Shipping Time Comparison
| Region/Route | Avg. Freight Cost (March) | Avg. Freight Cost (April) | % Change in Cost | Avg. Shipping Time (March) | Avg. Shipping Time (April) | Change in Days |
|---|---|---|---|---|---|---|
| Middle East → West Africa | 60–65 USD/MT | 75–80 USD/MT | +25–30% | 18–20 days | 25–28 days | +7–8 days |
| Middle East → India | 35–38 USD/MT | 45–50 USD/MT | +25–30% | 6–8 days | 10–12 days | +4 days |
| Middle East → Southeast Asia | 45–50 USD/MT | 55–60 USD/MT | +20–25% | 10–12 days | 15–17 days | +5 days |
| Middle East → Europe (via Cape) | 80–90 USD/MT | 100–110 USD/MT | +25% | 12–14 days | 19–22 days | +7–8 days |
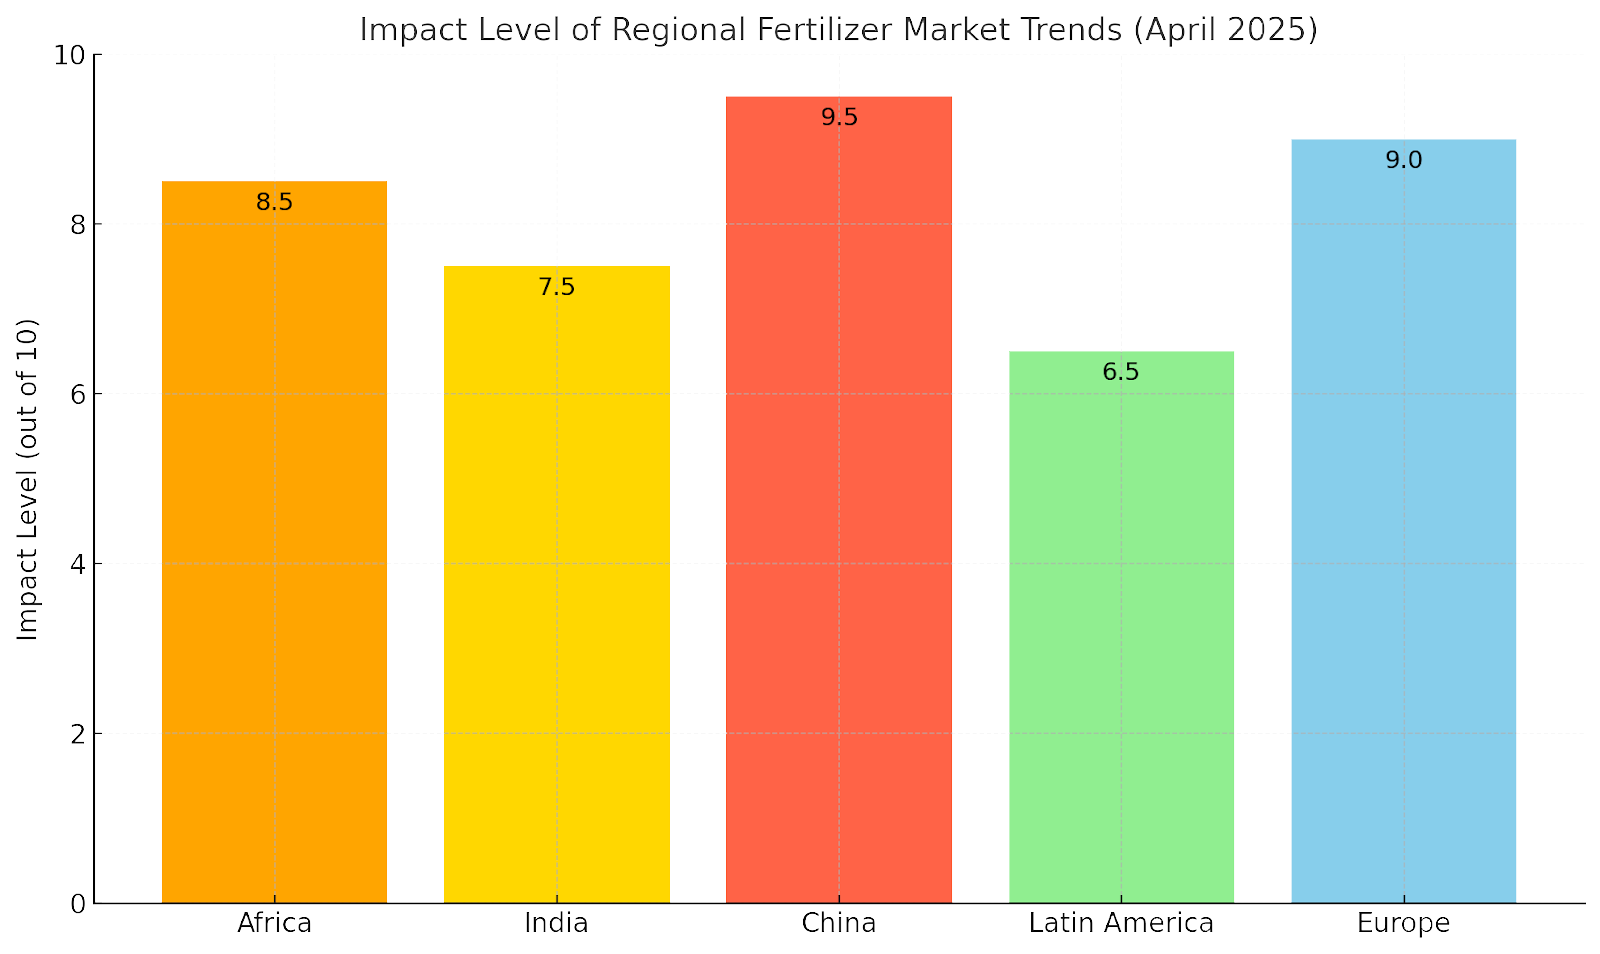
Regional Market Summaries
Africa: Adapting to Rising Costs and Seeking New Partnerships
West Africa: Fertilizer importers across Nigeria, Ghana, Côte d’Ivoire, and Senegal faced persistently high CFR prices in April 2025, with urea, DAP, and NPK shipments reflecting cost surges of USD 20–30/MT compared to earlier in the year. Red Sea freight disruptions drove these increases, rising vessel insurance premiums due to Middle East tensions, and tighter availability of bulk cargoes from traditional suppliers in Iran and the Gulf. In response, buyers have diversified sourcing strategies, actively engaging North African suppliers, particularly Morocco and Egypt, and Russian and CIS exporters. Additionally, Togo and Benin's regional blending and bagging hubs began gaining prominence as cost-effective alternatives.
- North Africa: Morocco further cemented its leadership in phosphate fertilizer exports. April saw robust DAP and MAP shipments from OCP’s Jorf Lasfar hub, with prices ranging from USD 600–620/MT FOB depending on grade and moisture content. Customized soil-specific formulations and enhanced efficiency fertilizers (EEFs) gave OCP a competitive edge in sustainability-driven tenders across Europe and West Africa. Egypt also maintained consistent urea exports in April, with prices supported by continued demand from Latin America and South Asia. Egyptian DAP was actively offered in multiple tenders, with FOB prices fluctuating between USD 683–745/MT during mid-April, depending on origin and shipment schedule.
Key Insight: African importers increasingly favor long-term supply agreements and decentralized procurement models to navigate freight volatility, war-zone risk premiums, and vessel delays. Investment in inland storage, blending facilities, and alternative corridors—such as via North Africa or direct West African terminals—is accelerating as part of broader supply chain resilience strategies.
India: Early Procurement, Sustainability Push, and Market Evolution
- Early Tender Strategy:
In anticipation of tightening global urea availability and rising freight costs due to heightened geopolitical risks, Indian importing agencies—including MMTC, NFL, and IPL—issued urea tenders earlier than usual in April 2025. The IPL tender was awarded over 3.55 million tonnes, with East Coast prices between USD 398–414/t CFR and West Coast prices from USD 385–400/t CFR. Although these awards came at a slight premium over February–March levels, they successfully secured essential volumes for the Kharif planting season. By acting early, India stood against looming price spikes, particularly from the Middle East and North Africa, and ensured better vessel scheduling amid global port congestion. - Shift Toward Granular Urea:
The April tender results confirmed a deepening shift toward granular urea over prilled. Granular urea was more competitively priced, with multiple bidders offering sub-400 USD/t CFR levels on the West Coast. Importers favored granular variants due to superior nitrogen use efficiency (NUE), improved flow in mechanized application systems, and reduced degradation during transit and storage—key advantages for India’s increasingly mechanized agriculture. - PM PRANAM Biofertilizer Momentum:
India’s PM PRANAM (Programme for Restoration, Awareness, Nourishment, and Amelioration of Mother Earth) program received renewed political and financial support in April. Several Indian states—especially Maharashtra, Tamil Nadu, and Uttar Pradesh—expanded pilot deployments of biofertilizers, including rhizobium-based inoculants, seaweed extracts, and fortified composts. District-level campaigns encouraged farmer adoption via direct subsidies, localized training, and demonstration plots, supporting the broader government objective of reducing reliance on synthetic nitrogen.
Key Insight: India’s fertilizer policy is evolving rapidly, balancing short-term procurement agility with long-term environmental goals. April’s early tender execution, combined with a strong push toward granular urea and biofertilizers, reflects a dual strategy for resilience and sustainability amid global market disruptions.
China: Tightened Exports and Green Fertilizer Revolution
- Export Controls and Quota Speculation:
Throughout April 2025, Chinese authorities maintained tight restrictions on fertilizer exports, focusing on urea and DAP. While no formal policy reversal was announced, rumors of a potential relaxation of export curbs caused significant turbulence in global urea markets. On 30 April, local stakeholders confirmed that urea exports are expected to resume from 6 May, with possible export quotas of 3.5–4 million tonnes valid through September. These would likely be restricted to select major producers, with renewed restrictions anticipated from October onward.
However, strict CIQ inspection protocols remain in effect, requiring 10 working days for certification. This means the first bulk shipments are not expected until late May. As a result, Chinese urea availability on the global market in early Q2 remains limited.
Market Reactions and Pricing Impacts:
The mere prospect of resumed exports triggered sharp corrections in global urea futures. Middle East May futures dropped by 37–40 USD/MT to 365 USD/MT FOB, Egyptian FOB futures fell to 375 USD/MT, and Brazil CFR prices slipped by 25 USD/MT to 380 USD/MT. These movements were largely speculative, as physical availability remained constrained in April, and Chinese spot exports for Q1 were minimal—just 6,300 tonnes, compared to 526,000 tonnes in Q1 2023.
Green Fertilizer Policy Acceleration:
In line with China’s national carbon neutrality roadmap and anticipation of the EU Carbon Border Adjustment Mechanism (CBAM), the country fast-tracked green fertilizer initiatives in April. Key developments included:
- Launch of pilot green ammonia plants in Inner Mongolia and Sichuan using wind and solar-powered electrolysis.
- Low-carbon urea production trials are conducted at state-owned facilities using CCS (carbon capture and storage).
- Deployment of blockchain-based carbon traceability systems for fertilizer exports aimed at EU buyers.
These shifts position China to remain a global player as international buyers increasingly prioritize carbon credentials.
- Domestic Market Stabilization:
To curb inflation and ensure agricultural stability during the spring season, Chinese regulators expanded fertilizer subsidies, enforced price ceilings through supplier coordination, and prioritized domestic supply in official guidance. As a result, many producers avoided customs clearance delays by limiting exports and focusing instead on domestic contract fulfillment.
Key Insight: China is pursuing a
strategic balancing act—protecting food security and rural stability at home while laying the technical and regulatory groundwork for sustainable fertilizer leadership abroad. The export landscape remains volatile in the short term, but structural investments in
green production and
carbon transparency signal a long-term pivot toward value-added, environmentally compliant exports.
Latin America: Toward Self-Reliance and Enhanced Fertilizer Efficiency
- Stable Import Flows Amid Global Volatility:
In April 2025, fertilizer import volumes across Brazil, Argentina, Mexico, and Colombia remained steady despite elevated global freight costs and continued supply disruptions from the Middle East. Strategic early procurement and reliance on long-term contracts enabled many countries to fulfill their Q2 agricultural needs, particularly in Brazil, which benefited from Q1 inventory buildup. - Brazil’s Fertilizer Self-Sufficiency Program Advances: Brazil’s Plano Nacional de Fertilizantes 2050 (PNF 2050) made concrete strides in April. Key developments included:
- New investment agreements to expand nitrogen and ammonia production in Mato Grosso and Bahia.
- Reactivation of phosphate mines in Goiás and Minas Gerais, supported by fast-tracked exploration licenses.
- Construction of regional blending hubs and micronutrient enrichment plants close to major agricultural zones.
The government reiterated its goal to
reduce fertilizer import dependence by 25% by 2035, a crucial step given that Brazil currently imports ~85% of its total fertilizer consumption.
- Surge in Specialty Fertilizer Demand: Markets across Peru, Chile, and Mexico also saw increased demand for value-added fertilizers, including:
- Micronutrient-fortified NPK blends (e.g., Zn, B-enriched 15-15-15).
- Controlled-release fertilizers (CRFs) and bio-stimulant-infused formulations.
- Custom blends tailored for high-value export crops like avocados, grapes, sugarcane, and cocoa.
Regional Logistics Resilience: Despite freight hikes, Latin American buyers displayed logistical agility, securing slots at alternative ports (e.g., Itaqui, Cartagena) and increasingly favoring CFR contracts with fixed laycan clauses to ensure timely arrivals.
Key Insight: Latin America matures from a volume-oriented fertilizer import model to a
resilience-focused, innovation-driven approach. With Brazil investing heavily in local fertilizer production and regional markets embracing
specialty and climate-smart inputs, the continent is laying the foundation for long-term
fertilizer sovereignty and productivity gains.
Europe: Regulation-Driven Fertilizer Transformation
- CBAM Regulatory Pressure: In April 2025, the forthcoming enforcement of the Carbon Border Adjustment Mechanism (CBAM) continued to reshape fertilizer procurement strategies across Europe. Importers, distributors, and cooperatives increasingly prioritized low-carbon, traceable, and EU-compliant fertilizers to meet upcoming documentation and carbon accounting requirements.
As a result, demand surged for:
- Green ammonia (produced via electrolysis or certified low-carbon methods),
- Blue urea (produced with carbon capture),
- Eco-labeled NPK blends with digital origin and emissions reporting.
Buyers in
Germany, France, and the Netherlands offered premium contracts for certified products, accelerating compliance-focused supply chain transitions.
- Granular Urea Consolidates Market Position: Granular urea continued to dominate nitrogen fertilizer purchases in Western and Southern Europe, favored for its:
- Lower volatilization rates compared to prilled variants,
- Ease of mechanical spreading and variable-rate application in precision systems,
- Compatibility with enhanced-efficiency additives (e.g., urease inhibitors).
Despite freight price hikes, April shipments to
Spain, Poland, and Italy reflected stable demand.
- NPK Fertilizers: Precision and Performance Focus: There was a notable increase in purchases of specialty NPK blends in fertigation-ready formats and precision nutrient mixes. Regional trends included:
- Southern Europe (Spain, Italy, Greece): There has been a surge in liquid and water-soluble NPKs tailored for greenhouse vegetables, fruit orchards, and vineyards.
- Eastern and Northern Europe: Uptick in
controlled-release and polymer-coated NPKs, often combined with
remote sensing platforms for in-season nutrient adjustment.
- Regulatory Compliance Becomes Central to Procurement: European buyers increasingly incorporate Environmental Product Declarations (EPDs), carbon intensity data, and QR-coded traceability systems in their tender processes. This shift is regulatory-driven and consumer-conscious, with downstream food processors demanding transparency in fertilizer sourcing.
Key Insight: Fertilizer procurement in Europe is now defined not merely by
price or availability, but by
sustainability, traceability, and regulatory compliance. Suppliers that fail to adapt to this shift may be excluded from strategic contracts across the continent.
Outlook for May 2025
Key Market Drivers and Expected Trends
The fertilizer and petrochemical markets are poised to remain volatile and strategically sensitive as we move into May 2025. Several macro and micro factors will be pivotal in shaping pricing, logistics, procurement strategies, and global trade flows.
Middle East Conflict: Ongoing Supply Chain Disruptions
- The geopolitical instability across parts of the Middle East, particularly affecting shipping lanes like the Red Sea, Strait of Hormuz, and Suez Canal, will continue to cause freight delays, port congestion, and elevated shipping insurance costs.
- Market participants should expect persistent price fluctuations in FOB values, especially for urea, ammonia, sulfur, and phosphates originating from Iran, Oman, Saudi Arabia, and the UAE.
- Potential further escalation may force additional route diversions around the Cape of Good Hope, adding transit times and logistics costs.
Indian Demand: Early Procurement Accelerates
- India’s fertilizer sector is entering the critical kharif season (summer cropping cycle), driving heightened demand for granular urea, NPK, and phosphates.
- Following successful early tenders in March-April, India is expected to issue additional spot tenders or government-to-government (G2G) contracts in May.
- Elevated Indian demand will support FOB price stability or mild increases, particularly from Middle Eastern and North African suppliers.
Chinese Exports: Continued Tightness
- China’s strict control on urea, DAP, and phosphate fertilizer exports is unlikely to loosen substantially in May.
- Limited Chinese availability will sustain tightness in the global nitrogen and phosphate markets, boosting demand for products from alternative suppliers like Morocco, Egypt, Russia, and Southeast Asia.
- Environmental policy shifts related to CBAM (Carbon Border Adjustment Mechanism) compliance preparations reinforce China’s cautious export stance.
Freight and Insurance Costs: Elevated Risk Premiums
- Freight rates and maritime insurance costs are forecasted to remain elevated throughout May.
- Red Sea and Persian Gulf region cargos are expected to attract significant premiums; CFR (Cost and Freight) offers to Africa, India, Southeast Asia, and Latin America will reflect these surcharges.
- Buyers increasingly request
flexible laycans,
FOB purchasing with own shipping, or
third-party insurance arrangements to mitigate risks.
Climate and Sustainability Momentum: Green Products on the Rise
- Global buyers — particularly from Europe, Japan, South Korea, and parts of Africa — increasingly favor green ammonia, low-carbon urea, organic fertilizers, and eco-certified NPK blends.
- Suppliers offering enhanced efficiency fertilizers (EEF), fertigation-compatible solutions, and carbon-tracked shipments are positioned to capture premium market segments.
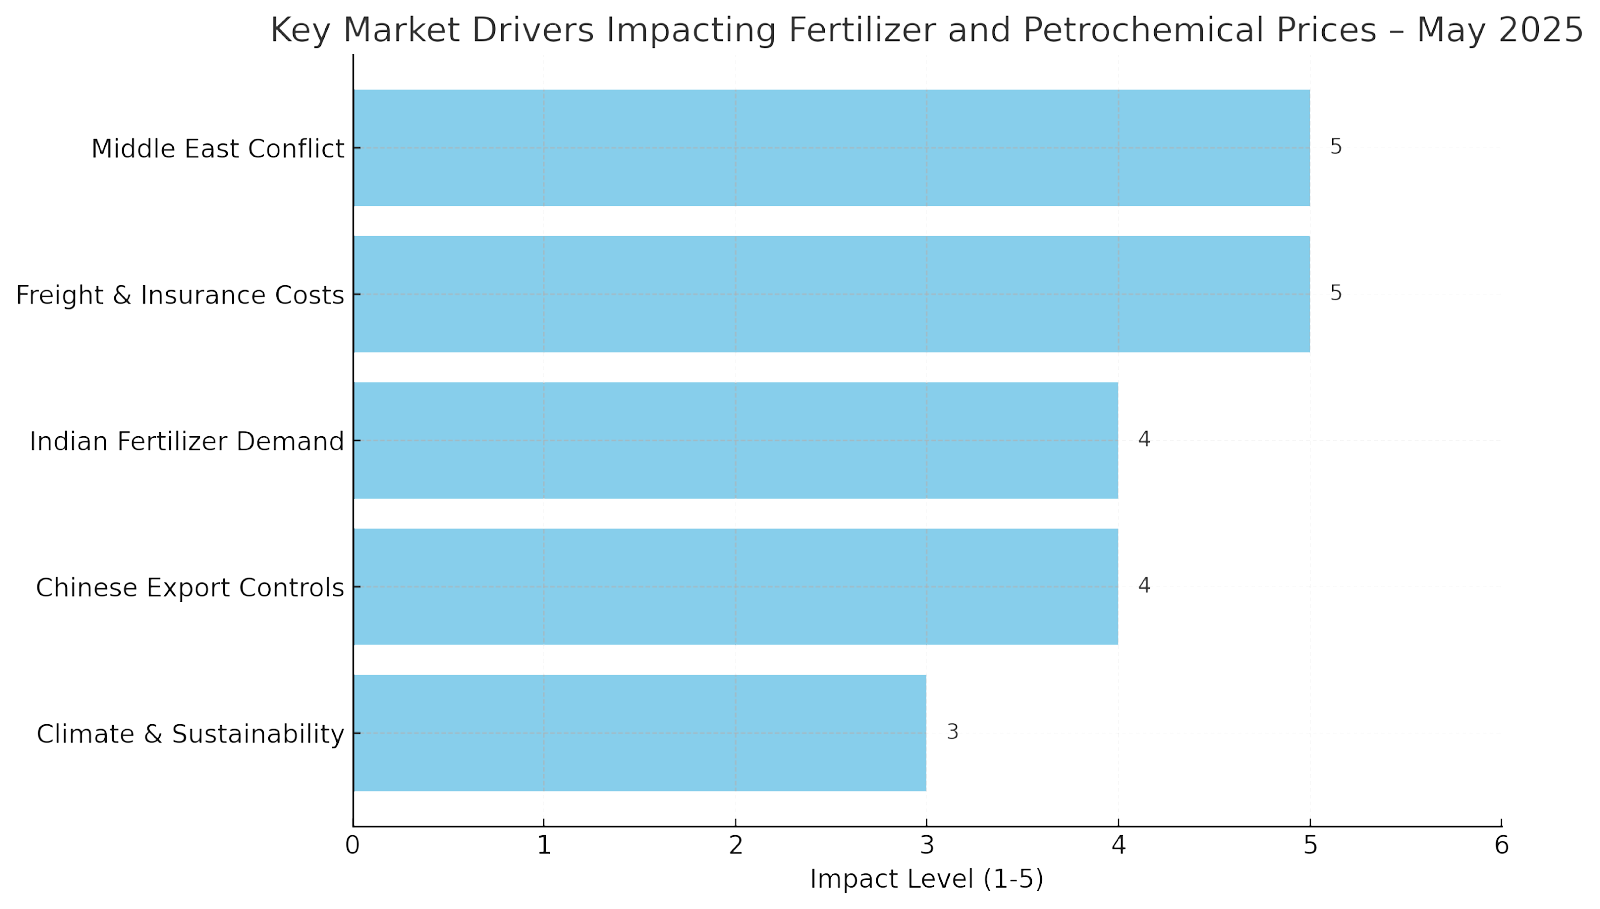
Quick Reference Table – May 2025 Market Outlook
| Key Driver | Impact | Outlook for May 2025 |
|---|---|---|
| Middle East Conflict | Freight disruptions, shipping delays | Price volatility, tight FOB availability |
| Indian Fertilizer Demand | Strong early kharif procurement | Supportive of stable to firm prices |
| Chinese Export Controls | Restricted fertilizer outflows | Sustained global tightness |
| Freight & Insurance Costs | Increased premiums, logistics bottlenecks | Higher CFR offers, longer delivery times |
| Climate and Sustainability | Policy-driven market transformation | Rising demand for green-certified products |
Market Sentiment Chart
| Factor | Downward Pressure | Stable | Upward Pressure |
|---|---|---|---|
| Urea Prices | ☑️ | ☑️ | |
| Ammonia Prices | ☑️ | ☑️ | |
| Sulfur Prices | ☑️ | ||
| NPK Prices | ☑️ | ☑️ | |
| Freight Rates | ☑️ | ||
| Insurance Premiums | ☑️ |
Legend: ☑️ indicates expected market pressure direction (stable or increasing).
Summary
Heading into May 2025, the global fertilizer and petrochemical sectors will operate under heightened tension due to overlapping logistical, geopolitical, and environmental factors. Prices for nitrogen, phosphate, and sulfur fertilizers are expected to remain either stable or edge higher, particularly for CFR contracts involving risk-prone regions.
Proactive procurement planning, diversified sourcing strategies, risk-adjusted freight management, and greater focus on sustainable fertilizer solutions will be essential for market participants aiming to mitigate volatility and capitalize on emerging opportunities.
References
- Argus Media – April 2025 Fertilizer Reports
- Profercy – Nitrogen and Ammonia Weekly Reports
- ICIS – Fertilizer and Shipping Updates
- World Bank – Agricultural Market Outlook
- FAO – Fertilizer Use by Region 2025
Green Gubre Group
Sourcing Excellence, Delivering Trust