Global Petrochemical and Fertilizer Market Review - February 2025
Price & Trade Trends
Author : Saman Memarpour
Executive Summary
February 2025 marked a dynamic period for the global petrochemical and fertilizer markets, with significant price volatility, supply chain disruptions, and shifting regional demand. In the fertilizer segment, urea prices softened due to India’s delayed tender. At the same time, DAP (Diammonium Phosphate) and MAP (Monoammonium Phosphate) saw upward pressure from tight supplies and robust demand in key markets like China and India. Sulfur and sulfuric acid prices climbed due to strong industrial demand, particularly in Indonesia, while ammonia prices dipped amid oversupply. Broader petrochemical trends, such as rising naphtha prices in Asia and softening jet fuel prices in Europe, underscored the interconnectedness of feedstock and fertilizer markets. This report provides a comprehensive breakdown of these price movements, regional dynamics, and key drivers shaping the petrochemical landscape in February 2025, empowering you with crucial insights for your strategic decisions.

Chart 1: Monthly Price Movements of Key Petrochemicals and Fertilizers (January vs. February 2025) (Bar Chart: Urea, DAP, MAP, Sulfur, Ammonia, Naphtha)
Global Fertilizer Price Movements (January vs. February 2025)
In February 2025, the fertilizer market experienced notable price fluctuations driven by supply constraints, geopolitical tensions, and seasonal agricultural demand. Some regions experienced price increases due to shortages, while others saw price declines linked to decreased purchasing activity or logistics disruptions.
The table below
compares fertilizer prices for February 2025 against
January 2025, highlighting
monthly price changes.
| Product | Feb 2025 price (USD/MT) | Jan 2025 price (USD/MT) | Price Change (%) |
|---|---|---|---|
| Urea (FOB Iran) | 385 | 390 | -1.28 |
| Urea (FOB SE Asia) | 430 | 420 | +2.38 |
| DAP (India CFR) | 636 | 633 | +0.47 |
| MAP (Brazil CFR) | 420 | 415 | +1.2 |
| Sulfur (FOB Iran) | 145 | 140 | +3.57 |
| Ammonia (FOB Middle East) | 310 | 320 | -3.12 |
| NPK (West Africa CFR) | 470 | 460 | +2.17 |
| TSP (India CFR) | 510 | 505 | +0.99 |
Table 1: Global Fertilizer Prices Comparison
Key Observations:
Urea Market: Price Declines in Some Regions, Gains in Others
- Iran: Urea prices declined by 1.3% (390 USD/MT → 385 USD/MT) due to India’s delayed import tender, which limited buying activity in February.
- US (NOLA): Prices ranged from 385 USD/st to 403 USD/st, impacted by weak demand and reduced seasonal purchases.
- Southeast Asia: Prices increased by 2.4% (420 USD/MT → 430 USD/MT) as steady demand from importers supported the market.
- Egypt & Algeria: Prices remained stable as buyers awaited the next major Indian purchase.
Market Outlook: If India resumes tendering in March, urea prices may rise as major buyers return.
Phosphates Market: Price Increases Due to Supply Constraints
- DAP (India CFR): Prices increased by 0.5% (633 USD/MT → 636 USD/MT), supported by:
a. Tight domestic stocks in India.
b. Strong demand from Brazil (record import volumes in 2024).
- MAP (Brazil CFR): Prices rose by 1.2% (415 USD/MT → 420 USD/MT) due to:
a. Seasonal agricultural demand for fertilizers.
b. Limited global supply of phosphates.
Market Outlook: Phosphate prices
will remain strong, especially if
India and Brazil continue heavy import activity.
Sulfur Market: Rising Demand Pushes Prices Higher
- FOB Iran Sulfur: Prices rose by 3.6% (140 USD/MT → 145 USD/MT), reflecting:
a. Tightening supplies in China.
b. Strong demand from Indonesia’s industrial sector.
- CFR China Sulfur: Prices climbed past 200 USD/MT as Chinese refiners struggled with sulfur availability.
Market Outlook: The sulfur market
is expected to stay firm, with
continued demand from Asia keeping
prices elevated.
Ammonia Market: Prices Declined Due to Oversupply
- FOB Middle East: Prices fell by 3.1% (320 USD/MT → 310 USD/MT), driven by:
a. Surplus supply from key exporters.
b. Limited demand from major ammonia-consuming regions.
- CFR Turkey: Prices declined to 500 USD/MT, reflecting weak buying interest.
Market Outlook: The ammonia market
may remain weak unless supply is reduced or global demand recovers.
Summary & Market Trends:
- Urea Prices: Declined in Iran and the US but increased in Southeast Asia due to steady demand.
- Phosphates: DAP and MAP saw price increases due to low stocks and strong demand from India and Brazil.
- Sulfur: Prices rose 3.6%-4.2% as China and Indonesia boosted purchases.
- Ammonia: Prices declined due to oversupply and weak demand from major buyers.
What to Watch in March 2025:
🔹 India’s Urea Tender: If India returns to the market, urea prices could recover.
🔹 Brazil’s Phosphate Demand: High import levels may keep DAP & MAP prices strong.
🔹 Sulfur Tightness in Asia: Continued demand from China could push prices higher.
🔹 Ammonia Market Uncertainty: Further price drops are possible if supply outpaces demand.
Regional Market Dynamics
February 2025
Fertilizer and petrochemical markets exhibit distinct regional trends influenced by agricultural cycles, trade policies, feedstock availability, and global economic conditions. While some regions experience supply shortages that drive price increases, others experience weak demand or trade restrictions that lead to price stabilization or declines.
Below is a
detailed breakdown of how
regional factors influenced
fertilizer and petrochemical markets in February 2025.
| Region | Market Trend | Key Price Movement and Insights |
|---|---|---|
| Asia-Pacific | Tight urea supply, strong naphtha demand | Urea SE Asia +2.4%; Naphtha prices increased due to higher demand from China. |
| China | DAP/MAP prices rising, supply constraints | DAP +3 USD/MT; MAP domestic at 410 USD/MT; New lithium carbonate production facilities opened. |
| Europe | CBAM pressures, softening jet fuel prices | NPK stable; DAP NW Europe +12 USD/MT; Yara’s Ferrara plant shutdown tightened supply. |
| North America | Volatile urea market, stable freight rates | Urea NOLA was 4.2%, DAP/MAP NOLA was 5 USD/st, and AdvanSix raised AMSUL to 440 USD/st. |
| Latin America | Steady fertilizer demand, strong crude prices | MAP Brazil is stable at 420 USD/MT; Tupi crude reached a 16-month high. |
| Africa | High DAP/urea import demand | Ethiopia secured 540,390MT DAP; EABC closed a 300,000MT urea tender. |
Table 2: Regional Market Trends
Key Regional Market Insights & Analysis:
1. Asia-Pacific: Strong Demand & Tight Urea Supply
- Urea Prices Rose: SE Asia urea prices increased by 2.4%, with stronger demand for March shipments.
- Naphtha Prices Increased: China’s growing demand for petrochemical feedstocks tightened supply.
- Malaysia & Indonesia Urea Output: No spot availability from Petronas impacted regional supply.
- India’s Absence: The lack of an Indian tender affected urea market sentiment.
Outlook: Continued demand in
China & SE Asia could keep
urea and naphtha prices high.
2. China: Phosphate Prices Rising, New Industrial Projects
- DAP & MAP Prices Increased: DAP rose by 3 USD/MT due to tight domestic supply.
- Lithium Carbonate Expansion: New production facilities in Sichuan province added pressure on feedstocks.
- Ammonia & Sulfur Markets Tightened: Ammonia supply constraints affected local production.
Outlook: Strong agricultural and
industrial demand will support phosphate & sulfur markets.
3. Europe: CBAM Regulations Impacting Trade, Fertilizer Prices Stable
- NPK Prices Remained Stable: CBAM uncertainty affected long-term contract negotiations.
- DAP NW Europe Increased by 12 USD/MT: Reflecting rising supply constraints.
- Yara’s Ferrara Plant Shutdown: This contributed to tight nitrogen-based fertilizer supply.
- Jet Fuel Prices Declined: Higher inventories in the ARA refining hub pressured prices.
Outlook:
CBAM adjustments could create
short-term trade disruptions, while
fertilizer demand remains stable.
4. North America: Volatile Urea Prices, Strong Ammonium Sulfate (Amsul) Demand
- Urea NOLA Prices Fell by 4.2%: Weak seasonal demand caused prices to soften.
- DAP/MAP Prices Dropped by 5 USD/st: Lower demand led to price corrections.
- Ammonium Sulfate (Amsul) Prices Increased: AdvanSix raised prices to 440 USD/st, with inland prices at 485 - 490 USD/st.
Outlook: Urea demand could
rebound in March with
potential Indian tenders.
5. Latin America: Strong Demand for Fertilizers & Crude Oil
- MAP Brazil Prices Stable at 420 USD/MT: Demand remained consistent.
- Tupi Crude Prices Reached a 16-Month High: Strong regional energy market performance.
- Atlas Agro Plans Domestic Fertilizer Production: Brazil invests in renewable ammonia plants.
Outlook: Fertilizer demand is
expected to stay strong, driven by
Brazil’s agricultural expansion.
6.Africa: High Urea & Phosphate Demand
- Ethiopia secured 540,390 MT DAP: A major tender boosted phosphate trade.
- EABC’s Urea Tender for 300,000 MT Closed: This reflects strong granular urea import needs.
Outlook: African demand remains high, supporting global phosphate & urea trade.
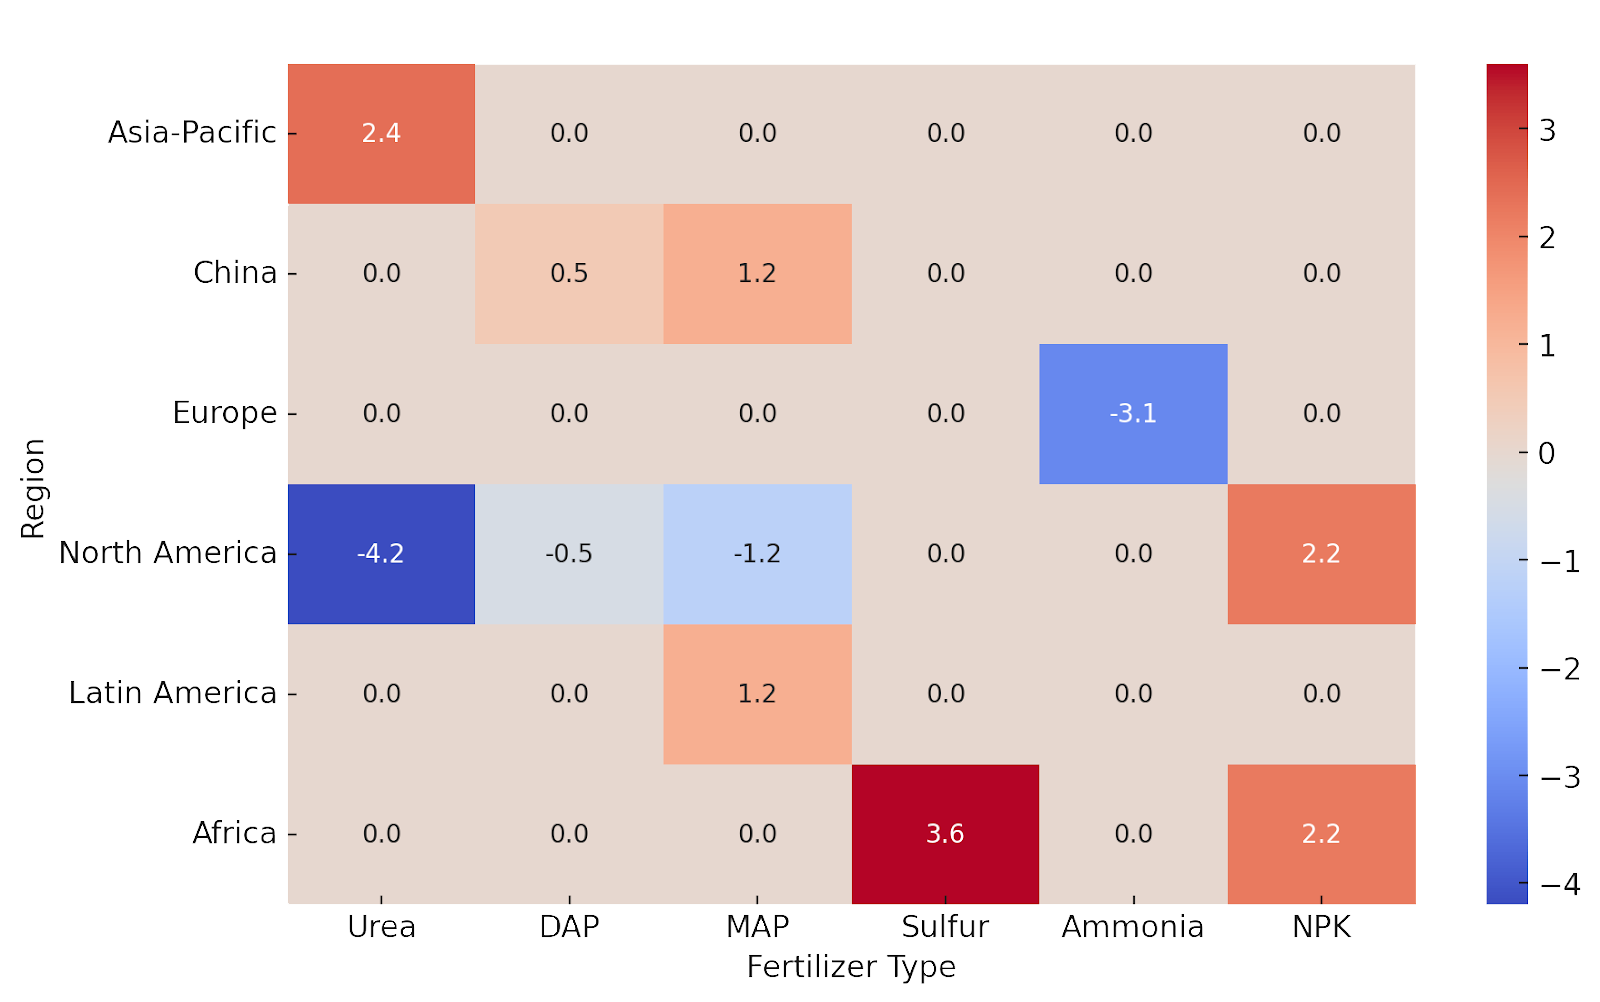
Chart 2: Regional Petrochemical & Fertilizer Trends (Heatmap: Price & Demand Intensity)
A heat map visualization provides an intuitive way to analyze regional price fluctuations and demand trends. The darker regions indicate high price increases, while lighter regions indicate stable or declining markets.
Heatmap Analysis – February 2025
🔥 High Demand Areas:
China & Southeast Asia: Rising naphtha & phosphate demand.
Brazil & Africa: Strong DAP & MAP imports.
Indonesia: Sulfur demand surge.
🟡 Stable Markets:
Europe: CBAM uncertainties balanced price movements.
North America: Volatility in urea & DAP.
🧊 Declining Markets:
Middle East Ammonia: Oversupply caused price drops.
US Urea (NOLA): Soft demand led to lower prices.
Regional Market Summary & Key Takeaways
1.Urea Market:
- SE Asia prices increased, while Iran & US (NOLA) declined.
- India’s delayed tender remains the most significant factor impacting urea prices.
2. Phosphates Market:
- DAP & MAP prices rose in India & Brazil due to low stocks & high demand.
- Ethiopia’s DAP tender reinforced Africa’s strong phosphate trade.
3. Sulfur Market:
- Rising sulfur demand in Indonesia & China.
- FOB Iran prices are up 3.6%, reflecting supply tightness.
4. Ammonia Market:
- Middle East ammonia prices declined due to oversupply.
- US ammonia demand remains uncertain.
5. Petrochemical & Feedstock Trends:
- Naphtha prices increased in Asia-Pacific.
- Jet fuel softened in Europe due to high inventory levels.
Outlook for March 2025
📌 Urea Market: Prices could recover if India returns to the market.
📌 Phosphate Demand: Expected to remain strong in Brazil, India & Africa.
📌 Sulfur & Ammonia: Volatility expected in response to China’s inventory levels.
📌 CBAM Impact: Further adjustments may impact European fertilizer exports.
Key Market Drivers and Influencing Factors
Several macroeconomic and sector-specific factors shaped the February 2025 market:
- India’s Delayed Urea Tender: Downward pressure on global urea prices persists, with RCF seeking 1.5 million MT and domestic stocks at 4.87 million MT.
- Phosphate Demand Surge: Tight supplies in China and India and Brazil’s 2024 imports bolstered DAP and MAP prices.
- Sulfur Market Strength: Indonesia’s industrial demand and China’s constrained supply drove sulfur prices to 145 - 200 USD/MT.
- Geopolitical Trade Risks: EU CBAM regulations and Russian sanctions disrupted phosphate and sulfur supply chains, while Yara urged export mechanisms to maintain competitiveness.
- Petrochemical Feedstocks: Asia’s naphtha market tightened due to reduced refinery runs, while palm oil export limits in Indonesia (CPO at a two-year high) impacted downstream chemical markets.
- Refinery Maintenance: Oversupply in WTI Midland crude weakened prices, influencing ammonia and sulfuric acid production costs.

Urea Market Deep Dive - February 2025
The global urea market remained volatile in February 2025, driven by:
- India’s delayed tender left buyers uncertain and limited bulk purchases.
- Price movements across different regions are mixed. Some markets tighten due to supply constraints, while others soften due to weak demand.
- Firm demand in Africa and Southeast Asia supported pricing in certain regions.
The
table below breaks down urea price movements by region, followed by an
in-depth analysis of key market developments.
| Region | Price (Feb 2025) USD/MT | Change from Jan (%) | Key Market Insights |
|---|---|---|---|
| Iran (FOB) | 385 | -1.3 | Prices weakened due to India’s absence from the market. |
| SE Asia (FOB) | 430 | +2.4 | Prices firmed amid steady demand and limited spot availability. |
| Brazil (CFR) | 420 | -1.2 | Prices softened slightly with delayed import interest. |
| US NOLA (FOB) | 385 | -4.2 | Weak demand pushed prices lower in the US. |
| Egypt (FOB) | 440 | +1.1 | Prices increased slightly due to firming demand. |
| Algeria (FOB) | 445 | +0.9 | Prices remained firm as North Africa maintained steady exports. |
Table 3: Urea Market Price Breakdown by Region
Key Urea Market Insights & Developments
1.India’s Delayed Tender: Market Uncertainty
- India’s urea tender (RCF) was delayed, leaving buyers hesitant.
- This created downward pressure on prices, particularly in Iran, the US, and Brazil.
- India’s domestic urea stocks stood at 4.87 million MT, excluding secured volumes, meaning a large purchase may be required soon.
- If India announces a tender in March, global prices could rebound.
Outlook: If India re-enters the market, urea prices could recover quickly. Until then,
weaker demand may continue.
2. Southeast Asia: Prices Holding Firm on Steady Demand
- Urea prices in SE Asia increased by 2.4% to 430 USD/MT FOB.
- Demand from Malaysia, Indonesia, and Thailand supported prices.
- Petronas (Malaysia) sold out until March, reflecting tight availability.
- Indonesia’s Kaltim is expected to announce a fresh tender soon.
Outlook: Firm demand could stabilize prices in SE Asia, especially if Indian buyers enter the market.
3. Egypt & North Africa: Stable to Slightly Stronger Prices
- Egypt’s FOB price rose 1.1% to 440 USD/MT, indicating firm buyer interest.
- Algeria’s FOB price increased 0.9% to 445 USD/MT, reflecting strong demand for premium cargoes.
- North African producers maintained export flows, keeping supply stable.
Outlook: Prices in Egypt and Algeria are expected to remain stable, with potential upside if
demand from Europe or India increases.
4. US Market (NOLA): Weaker Demand Pushed Prices Down
- NOLA barge prices dropped 4.2% to 385 USD/MT FOB due to:
a. Soft demand from domestic buyers.
b. Lower agricultural purchases in February.
- Suppliers may need to adjust pricing to clear available stocks.
Outlook: If
India remains absent, US urea prices
could face further downward pressure.
5. Brazil: Import Delays Weighed on Prices
- CFR Brazil prices softened 1.2% to 420 USD/MT, as:
a. Buyers are delaying imports and are waiting for lower prices.
b. Global prices remained uncertain, limiting trade.
- A potential Indian tender could shift sentiment and lift demand.
Outlook: Brazil’s urea market
remains stable for now, but any
Indian tender could spark a rebound.
6. Africa: Strong Demand Keeps Market Active
- EABC (East African Buyers Consortium) closed a 300,000 MT tender on Feb 20.
- This reflects the region's substantial granular urea import needs.
- West Africa also continued steady imports.
Outlook: Africa’s demand is expected to
remain strong, supporting
global trade flows.
Key Takeaways & Market Trends
📌 India’s delayed tender impacted pricing, with some markets weakening due to uncertainty.
📌 Southeast Asia’s demand helped keep prices firm, while US prices softened.
📌 Egypt & Algeria maintained strong pricing, showing stable export activity.
📌 Brazil delayed purchases, but demand remains intact for future tenders.
📌 Africa’s strong import demand continues to support global urea trade.
March 2025 Market Outlook
📌 India’s Tender Decision: If India announces a tender, urea prices could rebound sharply.
📌 Petronas & SE Asia Supply: If availability tightens further, prices may remain firm.
📌 Egypt & Algeria’s Exports: Should continue steady pricing, unless global demand weakens.
📌 Brazil’s Buying Interest: Likely to pick up, especially before the next application season.
Phosphate Market Analysis - February 2025
Phosphate fertilizers maintained strong pricing momentum in February 2025, supported by:
- Robust agricultural demand in major consuming regions (India, Brazil, and Africa).
- Supply constraints, particularly from China’s reduced export availability.
- Vigorous tender activity, including large purchases from Ethiopia and India.
The
table below outlines the price movements of
DAP (Diammonium Phosphate) and MAP (Monoammonium Phosphate)
in major global markets.
| Market | DAP Price (Feb 2025) USD/MT | MAP Price (Feb 2025) USD/MT | Key Market Insights |
|---|---|---|---|
| India (CFR) | 636 | - | OCP deal for 1.6 million MT DAP + 800,000 MT TSP nearing completion. |
| Brazil (CFR) | 645 | 420 | Steady demand kept MAP stable at 420 USD/MT. |
| Europe (FOB) | 650 | 430 | Vigorous domestic buying activity, despite CBAM uncertainty. |
| China (Domestic) | 620 | 410 | Limited exports from China kept prices high. |
| NW Europe | 662 | - | DAP rose by 12 USD/MT, reflecting higher import costs. |
Table 4: DAP & MAP Price Movements
Key Phosphate Market Developments & Insights
1.India: Large-Scale Phosphate Purchases to Support Domestic Supply
- India is finalizing a significant deal with OCP (Morocco):
a. 1.6 million MT of DAP
b. 800,000 MT of TSP (Triple Superphosphate)
- Indian Potash Limited (IPL) secured 45,000-50,000 MT of Australian DAP to meet rising demand.
- Due to continued import demand, DAP prices increased slightly (636 USD/MT CFR India).
Outlook: With
Indian government subsidies (NBS policy) supporting purchases,
phosphate imports are expected to remain strong.
2. Ethiopia: Secured 540,390 MT of DAP via Tender
- Ethiopia’s Agricultural Inputs Supply Enterprise (AISE) completed a large DAP purchase in February.
- This reinforces Africa’s growing phosphate demand, particularly in East Africa.
Outlook: Ethiopia’s fertilizer demand is expected to stay firm, with additional imports likely in
mid-2025.
3. Brazil: Steady MAP Demand Keeps Prices Firm
- MAP (Monoammonium Phosphate) prices remained stable at 420 USD/MT CFR Brazil.
- DAP demand also held firm (645 USD/MT CFR Brazil), supported by:
- Record fertilizer imports in 2024.
- Favorable agricultural conditions.
- Atlas Agro invests in a renewable ammonia plant to enhance domestic fertilizer production.
Outlook: Brazil’s phosphate market is expected to
remain stable, with
strong demand for the 2025 planting season.
4. Europe: Higher DAP Prices Amid CBAM Uncertainty
- DAP prices in NW Europe increased by 12 USD/MT (662 USD/MT FOB), reflecting:
a. Higher import costs.
b. Limited availability due to supply constraints.
- CBAM (Carbon Border Adjustment Mechanism) continues to impact phosphate imports.
- Fertilizer producers (e.g., Yara) have urged the EU to include export exemptions.
Outlook: Europe’s phosphate prices may remain elevated, especially
if CBAM restrictions tighten further.
5. China: Limited Exports Keeping Domestic Prices High
- Chinese domestic DAP prices reached 620 USD/MT, reflecting tight supply.
- MAP prices stood at 410 USD/MT, supported by stable domestic demand.
- China’s export restrictions are limiting the global phosphate supply.
Outlook: If China continues restricting phosphate exports, global prices may remain high.
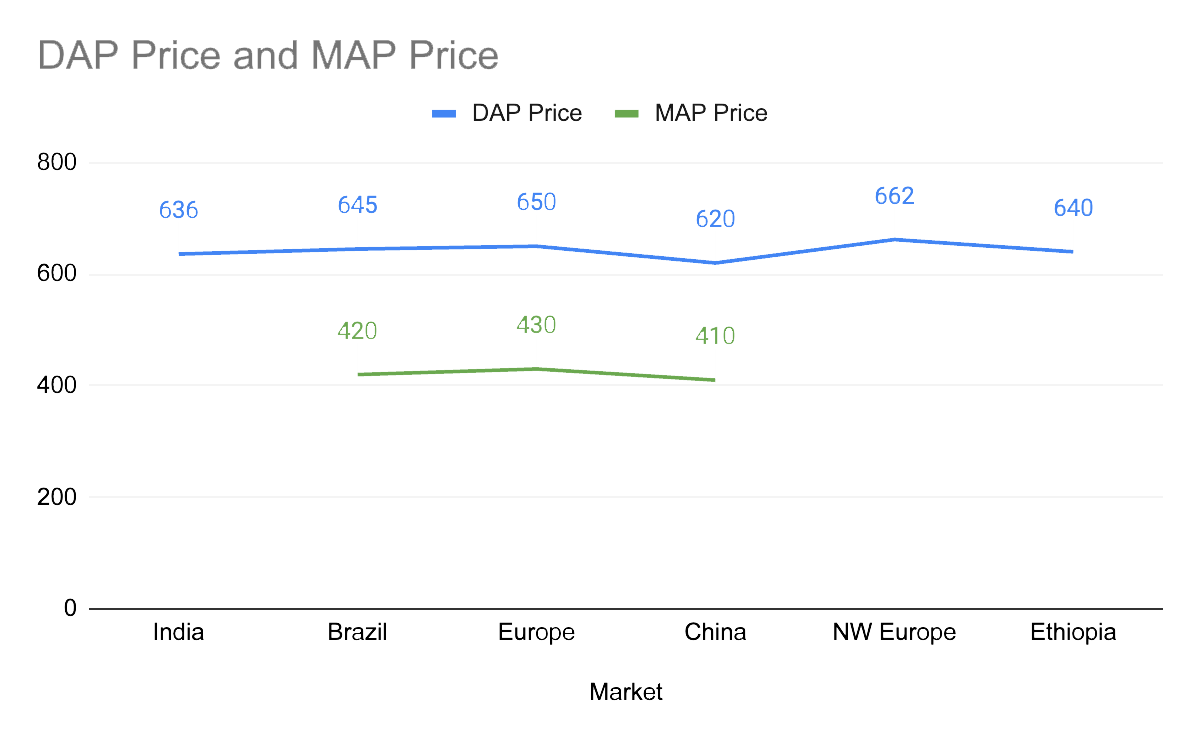
Chart 3: DAP & MAP Price Trends (Line Chart – February 2025)
A line chart visualization of DAP & MAP price trends in February 2025 highlights:
📈 Rising DAP prices in India, NW Europe, and Ethiopia.
📉 Stable MAP prices in Brazil, with no significant price shifts.
📊 Steady price increases in China’s domestic market due to export limits.
Key Takeaways & Market Trends
📌 India’s large DAP & TSP purchases will support long-term phosphate demand.
📌 Ethiopia’s tender reinforces Africa’s role as a growing phosphate importer.
📌 Brazil’s MAP market remains stable, with steady agricultural demand.
📌 CBAM & European fertilizer policies may impact future phosphate trade flows.
📌 China’s export policies remain a significant factor in global phosphate pricing.
March 2025 Market Outlook
📌 India’s following subsidy decisions will determine the pace of future phosphate imports.
📌 African phosphate imports will likely remain strong, particularly in East Africa.
📌 Brazil’s steady fertilizer demand will continue to support MAP pricing.
📌 European CBAM adjustments could shift phosphate trade patterns.
📌 Chinese export policies remain a critical variable for global supply.
Sulfur, Ammonia, and Ammonium Sulfate (Amsul) Market Trends – February 2025
The sulfur, ammonia, and ammonium sulfate (Amsul) markets exhibited divergent trends in February 2025, reflecting regional supply-demand imbalances and industrial sector fluctuations.
- Sulfur Prices Increased due to strong demand from Indonesia and China, while sulfuric acid faced weaker buying interest.
- Ammonia Prices Declined as oversupply in the Middle East and Turkey pressured prices downward.
- Due to strong demand, Amsul Prices Rose in North America, with AdvanSix increasing its granular Amsul quotes.
The table below provides
a detailed breakdown of price movements across these three key markets.
| Product | Feb 2025 Price (USD/MT or USD/st) | Change from Jan (%) | Key Market Insights |
|---|---|---|---|
| Sulfur (FOB Iran) | 145 | +3.6 | Strong demand from China & Indonesia, offsetting weak sulfuric acid sales. |
| Sulfur (CFR China) | 200 | +4.2 | Prices broke 200 USD/MT, driven by Chinese import needs. |
| Ammonia (FOB M. East) | 310 | -3.1 | Oversupply in the Middle East caused a price decline. |
| Ammonia (CFR Turkey) | 500 | -2.5 | Weak demand in Turkey contributed to price softening. |
| Amsul (AdvanSix, ex-Hopewell) | 440 (USD/st) | +2.3 | AdvanSix raised granular Amsul prices amid strong demand. |
| Amsul (Inland US) | 485 - 490 (USD/st) | +1.5 | Midwest and Ohio River markets saw higher inland Amsul pricing. |
Table 5: Sulfur, Ammonia, & Amsul Price Trends
Key Market Insights & Developments
1. Sulfur Market: Rising Demand in China & Indonesia Drives Prices Higher
- Sulfur prices increased by 3.6%-4.2%, with CFR China sulfur surpassing 200 USD/MT.
- China’s sulfur inventories dropped below 2 million MT, creating higher import demand.
- Indonesia’s fertilizer industry increased sulfur purchases, contributing to firmer prices.
- Iranian FOB sulfur prices rose to 145 USD/MT, reflecting export market demand.
Outlook:
📌 Strong sulfur demand in China & Indonesia may keep prices elevated.
📌 Further sulfuric acid market weakness could create short-term price fluctuations.
2. Ammonia Market: Middle East Oversupply Weighs on Prices
- Middle East ammonia prices dropped by 3.1% to 310 USD/MT FOB due to:
a. Higher production volumes from key exporters.
b. Limited buyer interest in key markets.
- Turkey’s CFR ammonia prices fell to 500 USD/MT, reflecting weak demand.
- Trammo sold a 25,000 MT ammonia cargo to OCP (Morocco) at 459 USD/MT CFR, marking a 76 USD/MT decline.
Outlook:
📌 Ammonia prices may remain weak unless production slows or demand picks up.
📌 Potential price recovery is expected if Indian or European buyers enter the market.
3. Ammonium Sulfate (Amsul) Market: Higher Prices in North America
- AdvanSix raised granular Amsul quotes to 440 USD/st, citing strong domestic demand.
- Inland Amsul prices increased to 485 - 490 USD/st in the Midwest & Ohio River markets.
- Export demand remained stable, with key shipments to Latin America and Southeast Asia.
Outlook:
📌 Amsul prices could continue rising, especially with strong spring fertilizer demand in the U.S.
📌 Export demand is expected to remain stable, supporting North American pricing.
Key Takeaways & Market Trends
📌 Sulfur prices increased due to strong demand from China & Indonesia.
📌 Ammonia prices declined due to oversupply in the Middle East & Turkey.
📌 Amsul prices rose in North America, with AdvanSix leading price increases.
March 2025 Market Outlook
📌 Sulfur demand in China & Indonesia will continue influencing global prices.
📌 Ammonia prices may remain weak unless major buyers (India, Europe) re-enter the market.
📌 Amsul prices in the U.S. will likely stay firm, supported by steady agricultural demand.
Broader Petrochemical Context - February 2025
The petrochemical market in February 2025, with naphtha, methanol, and jet fuel.
- Due to China’s high demand and refinery output constraints, Naphtha prices increased in Asia-Pacific.
- Methanol prices rose slightly in China, reflecting strength in the broader petrochemical sector.
- Jet fuel prices softened in Europe’s ARA hub as inventories grew, but Latin America’s Tupi crude reached a 16-month high.
1.Naphtha Market: Rising Prices in Asia-Pacific Due to Chinese Demand
Key Highlights:
- Asia-Pacific naphtha prices increased due to:
a. Higher demand from China’s petrochemical sector (used for plastic and chemical production).
b. Reduced refinery runs in the region, tightening supply.
- China remains the largest naphtha importer, supporting global demand.
- Higher naphtha prices impact fertilizer production costs, as ammonia and nitrogen-based fertilizers rely on natural gas and naphtha as feedstocks.
Outlook:
📌 Continued strong demand from China may keep naphtha prices elevated.
📌 If refinery runs increase, supply may improve, easing price pressures.
2. Methanol Market: Slight Price Increase in China Reflects Strength in Petrochemicals
Key Highlights:
- Methanol prices in China rose by 2 USD/MT, signaling stability in the petrochemical sector.
- Higher methanol prices impact chemical production, including:
a. Formaldehyde, acetic acid, and plastics.
b. Downstream petrochemical industries reliant on methanol derivatives.
- China’s methanol demand remains firm, driven by industrial and chemical sector consumption.
Outlook:
📌 Methanol prices may continue rising if petrochemical demand remains high.
📌 A slowdown in China’s economic activity could weaken demand and stabilize prices.
3. Jet Fuel Market: Softening in Europe, Strength in Latin America
Key Highlights:
- Europe’s Amsterdam-Rotterdam-Antwerp (ARA) hub saw jet fuel prices soften, driven by:
a. Higher inventories and lower than expected demand.
b. Stable refinery output maintaining supply.
- Meanwhile, Latin America’s Tupi crude prices surged to a 16-month high, reflecting:
a. Robust regional energy demand.
b. Tighter supply from Brazilian crude exporters.
- Jet fuel demand varies by region, with Latin America showing resilience compared to Europe’s softening market.
Outlook:
📌 Europe’s jet fuel prices could remain soft if inventories stay high.
📌 Latin America’s strong crude prices may support energy sector growth.
Key Takeaways & Market Trends
📌 Naphtha prices increased in Asia-Pacific, driven by China’s high demand & reduced refinery output.
📌 Methanol prices rose slightly in China, indicating a strong petrochemical market.
📌 Jet fuel softened in Europe’s ARA hub, while Latin America’s Tupi crude hit a 16-month high.
March 2025 Market Outlook
📌 China’s demand will continue influencing naphtha and methanol pricing.
📌 Jet fuel prices in Europe may stay weak unless demand rises.
📌 Latin America’s energy sector could remain strong, supporting crude oil pricing.
Conclusion & Outlook
Urea: Prices softened globally due to India’s delayed tender, but a market rebound is likely if India resumes purchases. Southeast Asia and Africa maintained steady demand.
📌 Phosphates: DAP & MAP prices strengthened, driven by tight supplies in China and high demand in India, Brazil, and Africa.
📌 Sulfur & Ammonia: Sulfur prices increased due to strong demand from China and Indonesia, while ammonia prices fell due to an oversupply in the Middle East.
📌 Freight: Rates stabilized, with Vancouver-to-China slightly up and US Gulf Coast steady.
Outlook for March 2025
📌 Urea: India’s tender could lift prices; watch Pupuk Holdings & Iranian exports.
📌 Phosphates: Sustained demand expected in India & Brazil’s agricultural cycle.
📌 Sulfur & Ammonia: Volatility tied to China’s stock levels and EU CBAM policy shifts.
📌 Petrochemicals: Naphtha & methanol may rise if refinery constraints persist.
References
- Argus Fertilizer Reports - Argus Media
- ICIS Fertilizer Market Analysis - ICIS.com
- Profercy Nitrogen Weekly Reports - Profercy.com
- S&P Global Commodity Insights - S&P Global
- CRU Fertilizer Market Reports - CRU Group
- European CBAM Regulations - European Commission
- India Fertilizer Tenders & Trade Data - Fertilizer Association of India
- Brazil Agro Market Data - Brazilian Ministry of Agriculture