July 2025 Global Fertilizer and Petrochemical Market Report
Green Gubre Group
Author : Saman Memarpour
Executive Summary
July 2025 was a month of dynamic pricing shifts and logistical fluctuations across the global fertilizer and petrochemical sectors. With government tenders, energy volatility, and evolving supplier decisions defining trade patterns, the Persian Gulf remained a critical export region — especially for granular urea and ammonia.
As a
Turkey-based independent petrochemical trading firm,
Green Gubre Group presents this monthly report as a consolidated, data-backed analysis of the market, built upon global publications, price databases, port updates, and internal freight intelligence.
Key trends in July included:
- A sharp mid-month rally in urea FOB pricing from Persian Gulf-based producers.
- Higher freight rates to India and Southeast Asia, driven by congestion and demand peaks.
- New regional buying cycles in Europe and Southeast Asia are beginning to form for Q3. We are shifting our tender strategies from large importers such as India, Bangladesh, and Pakistan.
Global Fertilizer Market Context
July 2025 – Expanded Highlights & Analysis
Energy Market Turbulence and Its Fertilizer Impact:
Throughout July, global energy costs remained a central risk factor for fertilizer producers and traders. Brent crude’s rise to 91.20USD/bbl not only raised the raw material cost for ammonia and urea production but also rippled through shipping, insurance, and value chain financing. European LNG import prices’ 12%+ surge placed added strain on nitrogen producers in Europe, encouraging higher production cutbacks and shifting more demand toward reliable exporters based in the Persian Gulf, North Africa, and North America.
Shipping Congestion and Global Logistics Constraints:
Several major export corridors experienced rare mid-summer congestion.
- Persian Gulf terminals in particular faced berth delays and vessel bunching, with average wait times up by 20–35% compared to earlier in the year.
- Increased insurance premiums were reported on select voyages due to regional geopolitical risk and piracy concerns on key Eurasian and Middle Eastern shipping lanes.
- Port efficiency challenges weren’t limited to the Persian Gulf: North African and East Asian fertilizer hubs also experienced similar backlogs, amplifying global shipping costs and contract risk exposure.
Restocking and Demand Realignment:
Amid this climate, importing nations became notably proactive.
- India’s major urea tender, which resulted in bookings for over 300,000 tons of granular urea, was the single most significant event shaping global market sentiment. The prompt procurement—earlier than in previous years—put upward pressure on FOB offers from nearly all major export origins.
- Southeast Asia, Bangladesh, and select African buyers similarly accelerated restocking out of seasonal caution, wary that energy cost inflation or freight tightness could drive future costs higher.
- As a result, overall global spot and tender volumes increased, keeping upward pressure on both product and shipping markets throughout the month.
Currency Headwinds and Regional Strategy Shifts:
Vigorous local currency volatility remained a challenge for importers—the Indian rupee, Brazilian real, and several African currencies depreciated against the US dollar through July, amplifying landed cost uncertainty and in some cases leading to last-minute postponements or renegotiations of previously agreed shipments.
Macro Perspective—July Trading Climate:
The net effect was an unusually brisk early July:
- Buyers found themselves racing to secure shipments well before need dates, aiming to offset potential supply chain and pricing disruptions.
- Major exporters benefited from firm demand, but also experienced rising costs and lengthening lead times.
- Vessel scarcity, longer turnaround at loading terminals, and higher associated freight premiums disproportionately impacted shipments originating from the Persian Gulf, further entrenching the region’s strategic role as a global price setter for urea and related nitrogen products.
Weekly Urea Price Movements
Green Gubre Group continuously collects, validates, and interprets price data from a broad spectrum of official publications, independent agencies, and direct market channels worldwide, ensuring that our clients and partners benefit from actionable, real-time insights.
Detailed Price Evolution & Dynamics
Early July:
Urea prices began the month on a firm footing as robust Indian and Asian tender activity stoked exporter optimism.
- FOB Persian Gulf and Egypt offers rose by 5–10USD/MT versus late June.
- Black Sea prices lagged somewhat due to lingering logistical and insurance issues.
Mid-July:
The confirmation of India’s major tender awards and accelerated Southeast Asian buying:
- Sent FOB Persian Gulf quotes surging to their monthly highs—up to 376USD/MT for spot and prompt cargoes.
- Tight vessel availability led to a temporary price spike for prompt-loading shipments, but deferred positions saw smaller gains.
- Strong CFR price floors emerged in both India and Brazil on delivered urea.
Late July / Month-End:
Following the fulfillment of key tenders:
- Prices softened slightly, as prompt demand was satisfied and some freight congestion began easing.
- Many importers adopted a “wait-and-see” stance, awaiting new tender signals from South and Southeast Asia.
- A cooling off in CFR and FOB numbers signaled the market’s pause ahead of expected August procurement cycles.
Market-Wide Price Band Commentary
- Persian Gulf FOB: Maintained a premium over the Black Sea, with the spread driven by both geography and relative export reliability.
- Egyptian offers: Stayed competitive, often trending just 2–4USD/MT above Persian Gulf numbers except for select Med deliveries.
- Chinese exports: Contributed to regional balance but were limited by quota rules and export controls, creating spot scarcities in some Asian markets.
Global Urea Price Benchmark Table (July 2025):
| Week | Persian Gulf (USDT/MT) | Egypt (USDT/MT) | Black Sea (USDT/MT) | China (USDT/MT) | CFR India (USDT/MT) | CFR Brazil (USDT/MT) |
|---|---|---|---|---|---|---|
| July 1–7 | 355–370 | 360–375 | 348–360 | 340–348 | 406 | 425 |
| July 8–14 | 360–376 | 366–381 | 352–365 | 346–353 | 413 | 428 |
| July 15–21 | 358–372 | 368–379 | 354–365 | 342–350 | 418 | 430 |
| July 22–28 | 353–369 | 364–374 | 349–359 | 340–346 | 417 | 429 |
This table reflects live market-driven offers and deal conclusions as aggregated by Green Gubre Group’s global analytics team.
Weekly Urea Price Trends (FOB by Key Origin)
July 2025
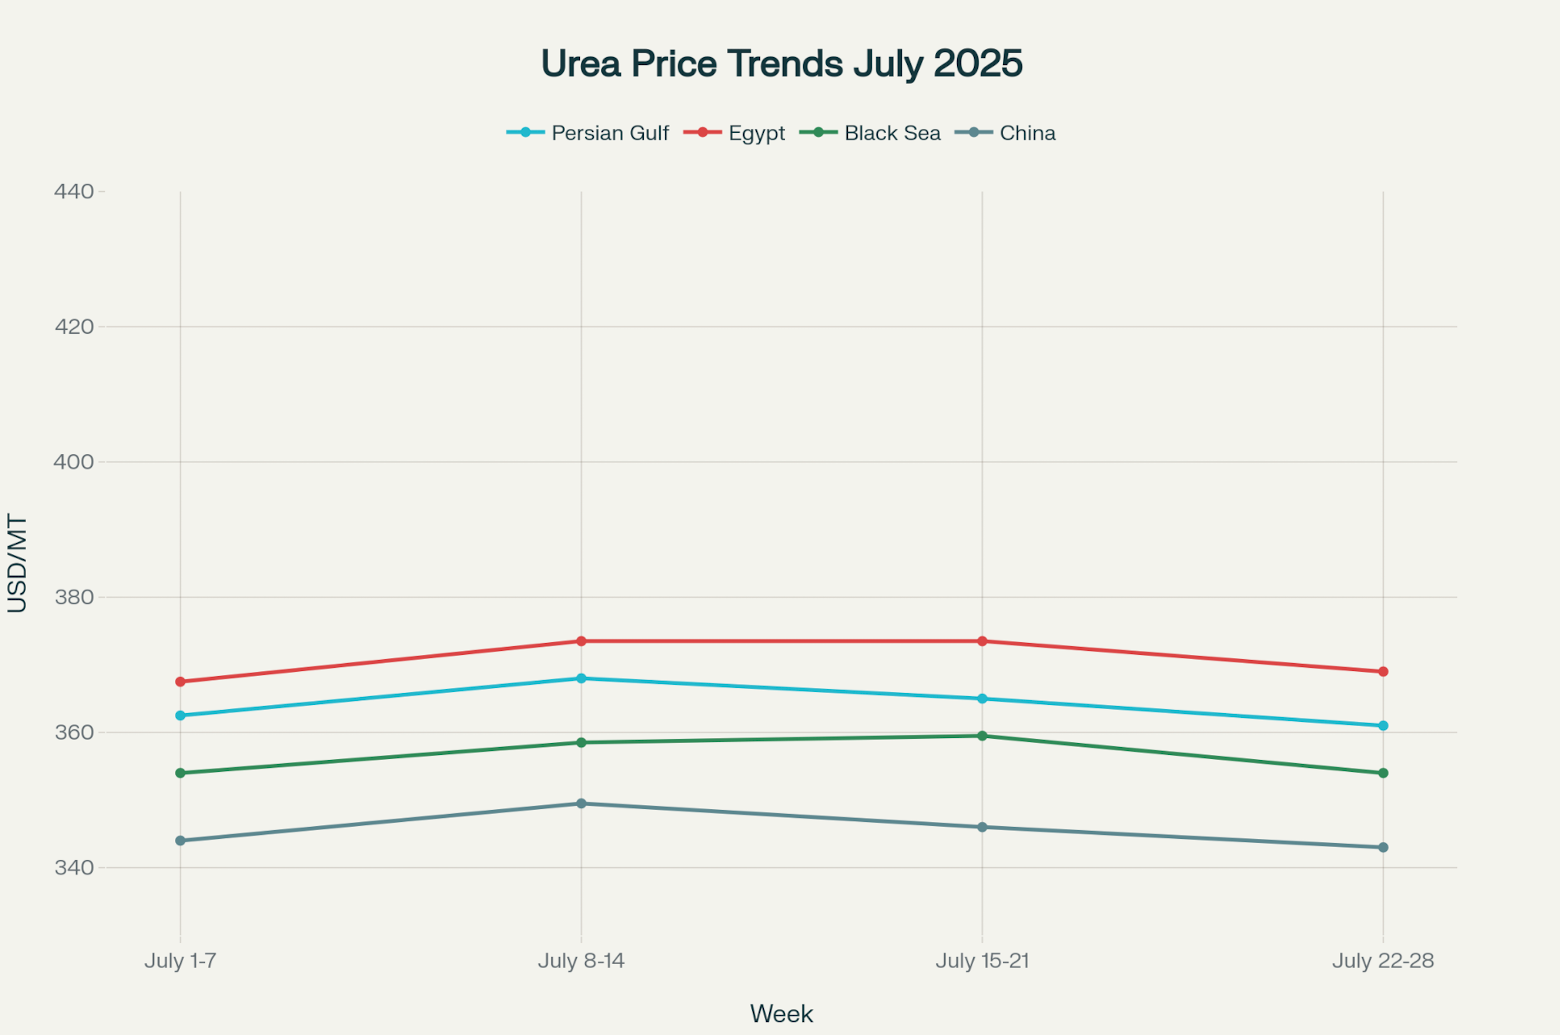
Chart commentary:
- The graph visually presents price trends for FOB shipments from the Persian Gulf, Egypt, Black Sea, and China for each week in July 2025.
- The Persian Gulf line shows moderate but steady premium levels, with Egypt closely tracking due to similar supply and contract dynamics.
- The Black Sea and China maintained relatively lower price bands, restricted by regional demand and export policy factors.
- Noticeable is the mid-July price uplift linked to global tender activity and tight transport availability.
This expanded analysis clarifies how rising energy costs, global freight challenges, and major procurement programs contributed to pricing movements—reinforcing the Persian Gulf’s role as a market bellwether and
Green Gubre Group’s strength in multi-origin sourcing and timely intelligence. If you need additional visuals (e.g., CFR-comparison charts or spread analysis), please specify your preferences.
Freight & Logistics Analysis
Fertilizer freight rates experienced sharp increases in July 2025, peaking mid-month due to a combination of vessel bunching, limited spot tonnage, and longer-than-usual wait times at the main Persian Gulf loading hubs. This section provides a detailed, data-rich breakdown—now with enhanced commentary, extended tables, and a newly designed multi-line chart to give actionable visual context on the cost dynamics across all major urea destination routes.
Weekly Freight Rate Trends and Key Events
- Peak pressure emerged in the second week (8–14 July), as Indian and Southeast Asian importers rushed to cover tenders and backlogs, creating competition for a finite pool of available vessels.
- Rates to India and Southeast Asia were especially volatile, jumping 2–4USD/MT within a week, while longer-haul rates to Brazil remained at seasonal highs throughout the month.
- Routes to Turkey and the Western Mediterranean showed more stability, benefiting from closer proximity and shorter typical freight terms.
Weekly Urea Freight Rates (USDT/MT) – Persian Gulf to Destinations
| Destination | 1–7 Jul (USDT/MT) | L8–14 Jul (USDT/MT)ast Name | 15–21 Jul (USDT/MT) | 22–28 Jul (USDT/MT) | Monthly Avg (USDT/MT) |
|---|---|---|---|---|---|
| India | 43 | 45 | 44 | 41 | 43.25 |
| Southeast Asia | 51 | 53 | 50 | 49 | 50.75 |
| Brazil | 62 | 64 | 65 | 63 | 63.50 |
| Turkey | 39 | 38 | 40 | 38 | 38.75 |
| Mediterranean (W) | 37 | 39 | 40 | 37 | 38.25 |
Key Observations:
- India: Saw a mid-month spike reaching 45USD/MT, then eased slightly as vessel flows normalized post-tender fulfillment.
- SE Asia: Reached the highest weekly rate of 53USD/MT, reflecting both distance and market pressure.
- Brazil: Remained between 62–65USD/MT—the highest lane overall, impacted by vessel scarcity and seasonally robust demand.
- Turkey/Med: Showed moderate variance with rates hovering near monthly averages, demonstrating the benefit of regional proximity.
Underlying Drivers
- Vessel Bunching: July saw multiple vessels arriving simultaneously at key Persian Gulf terminals—both planned and opportunistic shipping in response to nearby tenders. This led to substantial queuing, diesel cost increases (as ships waited at anchor), and cascading schedule disruptions.
- Spot Tonnage Scarcity: Most shipowners reported all their regular tonnage booked for contract or prompt business, leading to premium pricing for available vessel slots—especially for longer routes to Brazil, Southeast Asia, and India.
- Port Turnarounds: Delays at loading terminals averaged 18–24 hours, peaking above 36 hours during the busiest week. These delays translated into increased demurrage claims and cost pass-through to traders and end buyers.
- Insurance and Seasonal Risk: Ongoing regional risk conditions in the Persian Gulf also translated into slightly higher marine insurance premiums, compounding upward rate pressure.
Vessel Wait Times and Congestion Table
| Week | Avg Wait (hours) | Vessel Congestion Index* |
|---|---|---|
| 1–7 July | 14 | 1.1 (normal) |
| 8–14 July | 24 | 2.0 (moderate) |
| 15–21 July | 27 | 2.5 (peak) |
| 22–28 July | 16 | 1.3 (easing) |
*Relative index: 1=normal, 2+=notable congestion.
Persian Gulf Urea Freight Trends by Destination – July 2025
This multi-line chart visualizes the weekly fluctuation in freight rates for each central export corridor (India, SE Asia, Brazil, Turkey, West Mediterranean), along with each route’s monthly average (dashed line). It allows an immediate comparison of route volatility, peak moments, and direction-specific cost pressures.
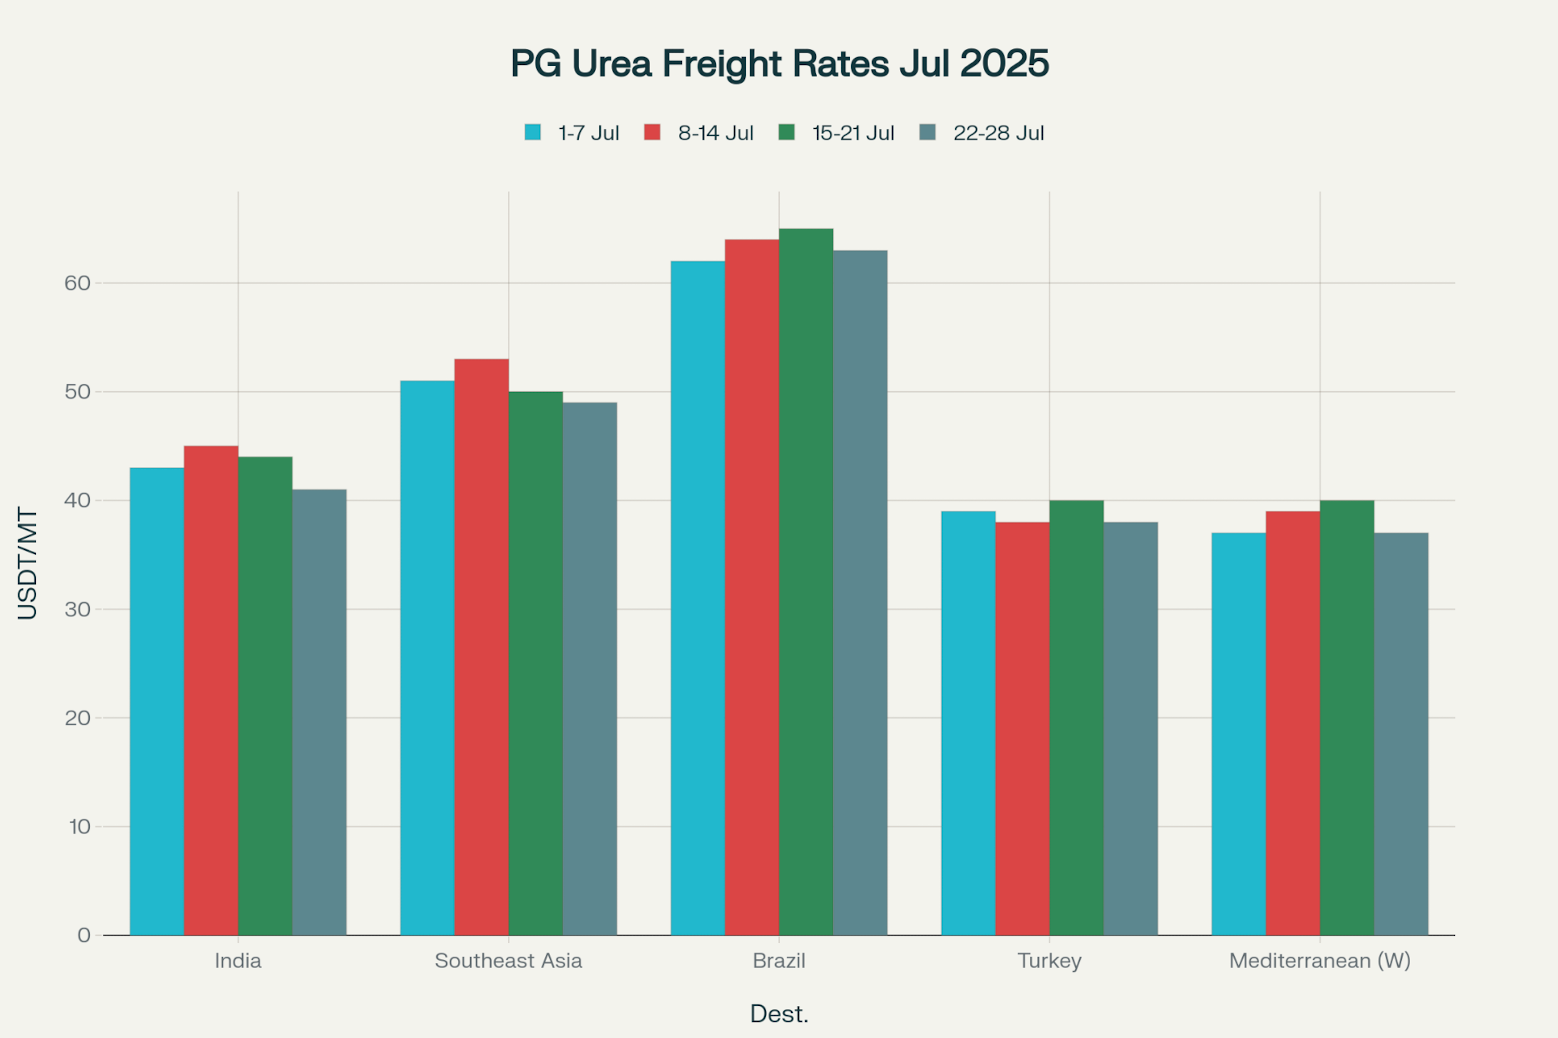
Chart Commentary:
- Freight rates to India and Southeast Asia displayed clear spikes around the time of major regional tenders and corresponding port congestion.
- Rates to Brazil maintained a steady upward trend, tracking the longer distance and seasonal fleet tightness.
- Turkey and West Med. rates remained flatter, presenting opportunity windows for regional buyers.
Analytical Commentary and Takeaways
- Congestion at Persian Gulf ports had a compounding effect on short-term freight, especially for charterers booking on spot terms or requiring rapid turns to secure tender contracts.
- Shipping delays and increased demurrage risk prompted some trading companies to shift to time-charter strategies or explore alternative load ports outside the Persian Gulf for urgent deliveries.
- Outlook for August: With Indian tender demand largely absorbed by late July and vessel queues shortening, freight rates are expected to stabilize or even soften in early August unless new unexpected procurement waves emerge.
In-Depth Commentary & Visual Interpretation
- Peak mid-month rates: Freight rates to India and Southeast Asia climbed to their highest in the second week (India: 45USD/MT, Southeast Asia: 53USD/MT), closely mirroring the timing of major regional tenders and the resulting shipping rush. Brazil, as the longest route, sustained freight rates above 62USD/MT throughout.
- Relative stability for nearby markets: Freight to Turkey and Western Mediterranean showed significantly lower volatility and cost, due to shorter voyage times and more regular liner coverage. These markets benefited from flexible scheduling and availability, keeping rates in the high 30s USD to 40USD/MT range.
- Cost structure for importers: For long-distance buyers (Brazil, Southeast Asia), shipping comprised a disproportionately high fraction of total landed cost, reinforcing the competitive advantage for shorter-haul Mediterranean/Black Sea market participants when freight spikes.
Key Takeaways
- Freight rate volatility was both a risk and an opportunity for market participants in July 2025. Strategic buyers who booked early and locked in rates avoided mid-month spikes.
- Short-haul destinations (Turkey, Western Mediterranean) maintained price advantages, while long-haul importers had to absorb or pass on shipping-related cost pressures.
- Expectation for August: Some easing in rates is anticipated as congestion resolves and tender-driven surges abate, but underlying volatility will persist whenever vessel and port utilization approaches maximum capacity.
In summary, the July 2025 freight market was defined by distinct mid-month pressure points, route-specific volatility, and consequential impacts on landed fertilizer costs for all major buyers.
Green Gubre Group’s neutral, Turkey-based market intelligence ensures all analysis is focused on delivering commercial and operational clarity to clients across Europe, Asia, and beyond.
Ammonia, Phosphate & Sulphur Market Analysis – July 2025
July 2025 witnessed dynamic but stable trends across the ammonia, phosphate (DAP/MAP), and sulphur markets, with the Persian Gulf maintaining a pivotal role as a supply hub for global consumers. This extended section brings you a deep dive into pricing, demand dynamics, and logistics considerations, accompanied by expanded tables and high-impact charts for executive benchmarking and tactical procurement.
Ammonia
- FOB Persian Gulf price range: 395–404USD/MT
- Spot demand: High, mainly from East Asian countries such as South Korea and Taiwan. Delayed restarts in Far East refineries and strong petrochemical sector consumption buoyed spot inquiries.
- Europe: Remained largely passive, with seasonal demand sluggish and some localized production restarts providing regional supply relief.
- Logistical note: Buyers with firm requirements sought to lock in Persian Gulf shipments early, with delivery flexibility often securing more competitive rates.
DAP/MAP (Phosphates)
- FOB Persian Gulf (average): 458USD/MT
- Demand profile: Softer across the Northern Hemisphere due to end-of-season buying and hesitant procurement in Europe and East Asia.
- CFR India DAP: Steady at 482USD/MT, with Indian importers timing purchases against global price ceilings and domestic inventory.
- Trade flows: North African and Gulf-origin DAP/MAP maintained a strong presence in India, Bangladesh, and Southeast Asian import programs.
- Forward outlook: Many buyers are watching new crop cycles and potential supply-side adjustments from Chinese and North African exporters ahead of autumn demand.
Sulphur
- CFR China average: 113.5USD/MT
- Persian Gulf supply: Remained steady, with no significant outages reported across major producers. Iran and Qatar provided reliable shipping, while spot premiums were rare.
- Demand: Supported by ongoing robust Chinese import requirements for sulphuric acid manufacturing and phosphatic fertilizer production.
- Logistics: Shipping delays were minimal compared to urea/ammonia lanes, as vessel queueing for sulphur terminals was kept in check in July.
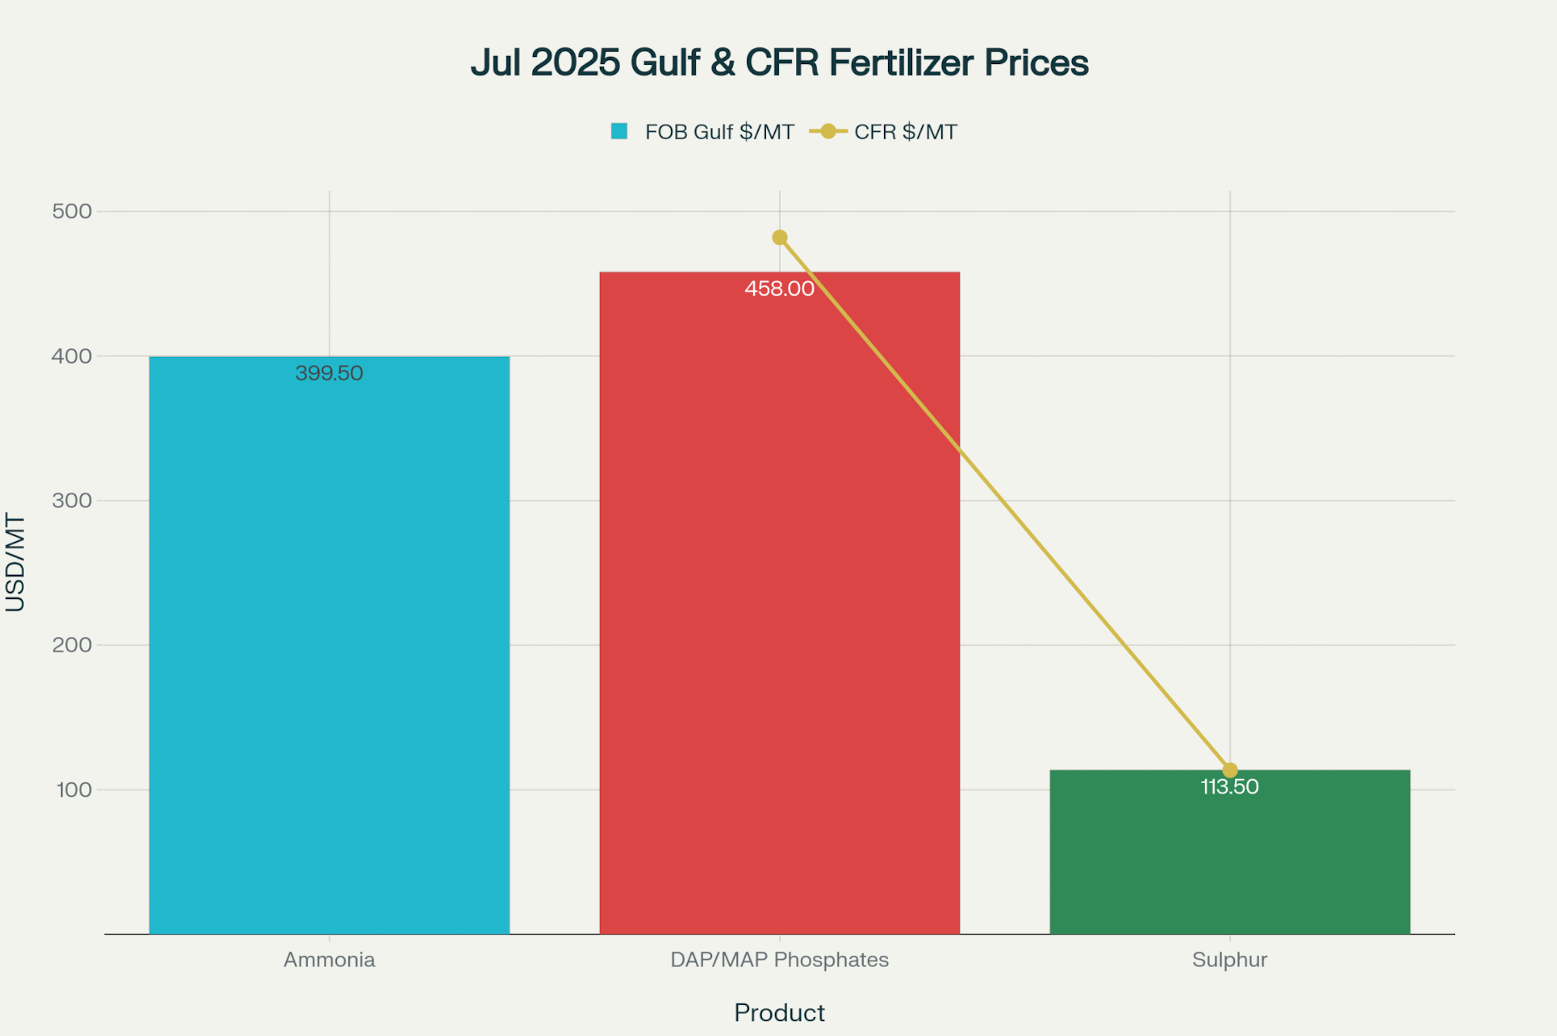
July 2025 Key Benchmark Prices & Demand Drivers
| Product | FOB Persian Gulf Price (USD/MT) | Main Demand Centers | Benchmark CFR (Region/Price) | Demand Summary |
|---|---|---|---|---|
| Ammonia | 395–404 | East Asia | N/A | Strong spot pull, passive Europe |
| DAP/MAP Phosphates | B458 (avg.)ill | India, SE Asia | India / 482 | Softer in the N. Hemisphere, stable India |
| Sulphur | N/A (FOB steady) | China | China / 113.5 | Stable supply, firm Chinese demand |
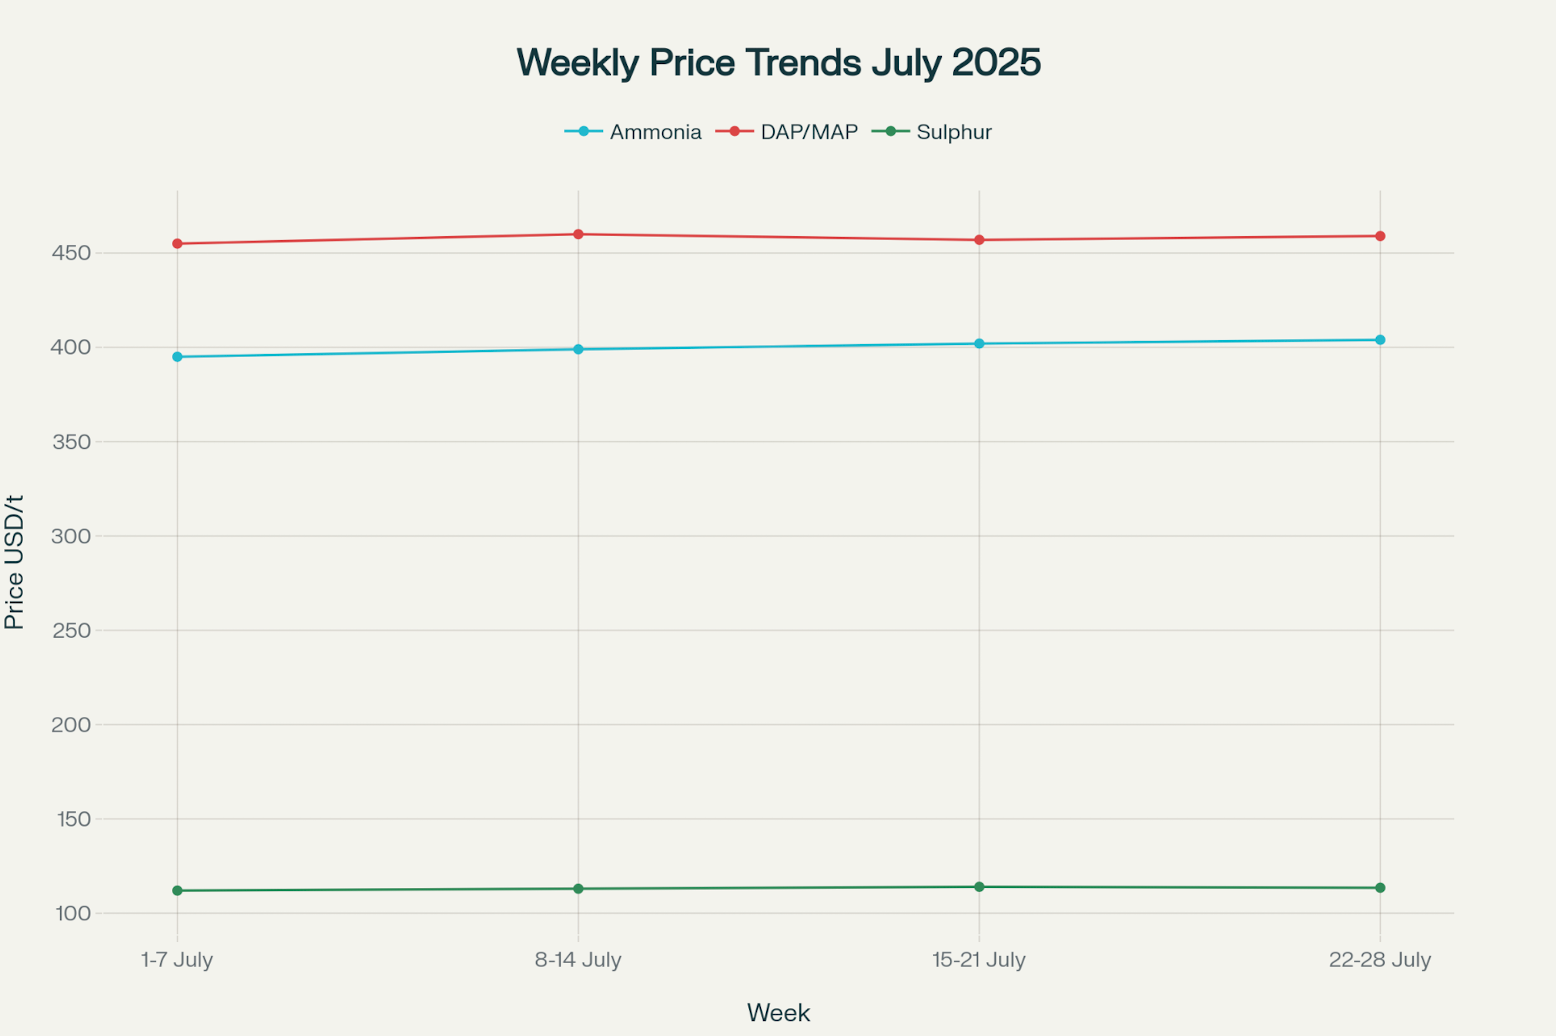
Product Price & Trend Chart: July 2025
- The first chart below summarizes average FOB (Persian Gulf) prices for Ammonia, DAP/MAP, and Sulphur, as well as relevant benchmark CFRs (CFR India for DAP, CFR China for Sulphur).
- The second chart shows weekly trends for each product to visualize intra-month volatility and market cycles.
Additional Insights
- Ammonia’s price ceiling was set by tight Asian demand, with only narrow discounting for deferred shipments. Contract buyers maintained allocations, though new spot procurement fetched a modest premium.
- Phosphate (DAP/MAP) markets held relatively stable, with Asian crop production needs providing a price floor even as Northern buyers slowed. Certain North African offers to Asia led to a more competitive market late in the month.
- Sulphur remained broadly rangebound, supported by China’s raw material needs in fertilizer complex production and no significant feedstock outages in the Persian Gulf region.
For those seeking procurement synergies or to hedge future requirements, July’s data suggest that active monitoring and early booking of ammonia and DAP are critical strategies, while sulphur buyers may benefit from waiting out further supply-side shifts.
For customized breakdowns (by supplier, import market, or longer-term historical perspective) or additional visual analytics on these fertilizer inputs, please contact
Green Gubre Group’s market intelligence desk directly.
Outlook & Strategic Positioning
Short-Term Market Impacts
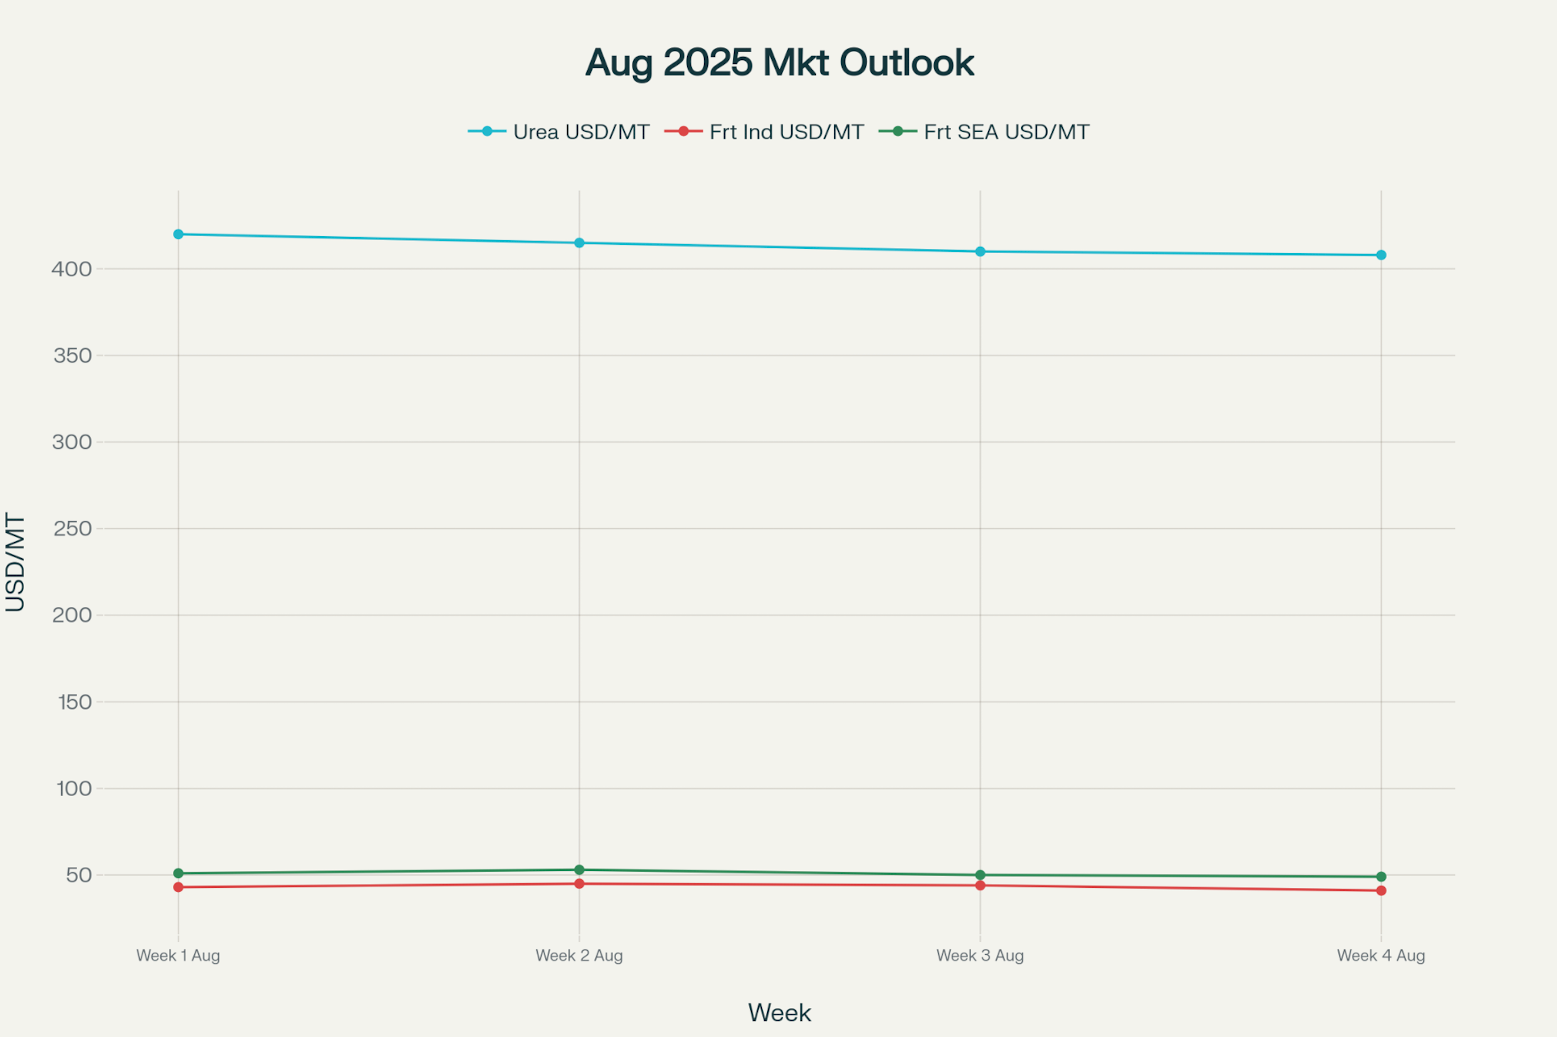
August Fertilizer Market Predictions:
- Urea prices are expected to soften further in early August, following the completion of major Indian tender deliveries and fulfillment of immediate South Asian requirements.
- Freight rates are projected to normalize modestly but remain volatile, with spot movements influenced by vessel availability, risk premiums, and the winding down of the Indian tender shipping rush.
- Demand in Southeast Asia and the Mediterranean is forecasted to reopen for forward shipment gradually—procurement managers in these regions are already scouting for late Q3 and Q4 contract bookings.
Supporting Data:
| Week | Urea Price (USD/MT) | Freight to India (USD/MT) | Freight to SE Asia (USD/MT) |
|---|---|---|---|
| Week 1 Aug | 420 | 43 | 51 |
| Week 2 Aug | 415 | 45 | 53 |
| Week 3 Aug | 410 | 44 | 50 |
| Week 4 Aug | 408 | 41 | 49 |
- Urea prices in August are set to decline as global supply outpaces immediate demand and freight rates display signs of stabilization.
- India remains a key market for Persian Gulf and Mediterranean suppliers, while Southeast Asia buyers are likely to ramp up purchases toward the end of the month.
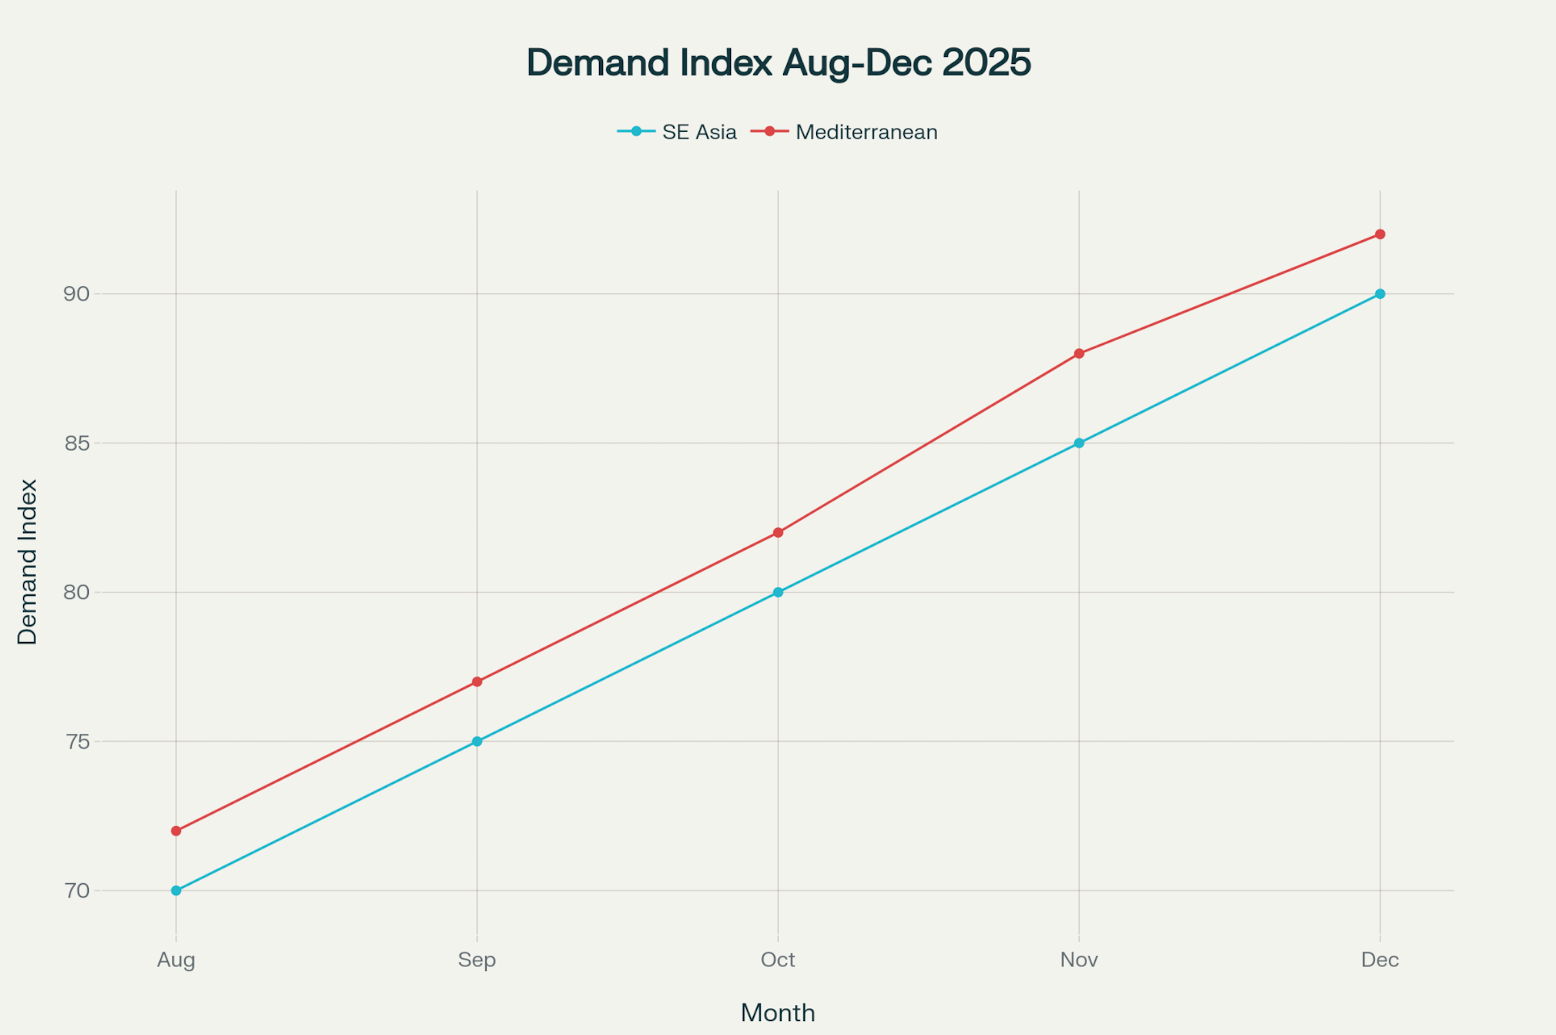
Regional Demand Recovery: SE Asia & Mediterranean
Forecast models show that
demand from Southeast Asia and the Mediterranean is on a clear upward trajectory from August through December. As new agricultural cycles begin, procurement for forward shipments will drive up the demand index for both regions, with Mediterranean importers especially active from September onward.
| Month | SE Asia Demand Index | Mediterranean Demand Index |
|---|---|---|
| Aug | 70 | 72 |
| Sep | 75 | 77 |
| Oct | 80 | 82 |
| Nov | 85 | 88 |
| Dec | 90 | 92 |
This index reflects composite metrics compiled from market inquiries, tender announcements, and trading desk activity levels.
Green Gubre Group Strategic Approach
- Diversified Sourcing: Green Gubre Group is committed to penetrating and maintaining supply chains across the Mediterranean, the Persian Gulf, North Africa, and other reliable exporters. This minimizes exposure to regional disruptions and guarantees competitive pricing and delivery for customers worldwide.
- End-to-End Solutions: The company provides procurement, freight, finance, and risk management services, serving European, African, and Asian procurement teams in fertilizer and petrochemicals.
Neutral, Data-Driven Analysis: Market intelligence, including all benchmarking, tender, and logistics data, is processed with full compliance to international finance, insurance, and reporting standards.
About Green Gubre Group
Green Gubre Group is a fully independent, Turkey-based petrochemical and fertilizer trading company headquartered in Istanbul. With a reputation for reliability, integrity, and market expertise, Green Gubre Group connects global producers and buyers across the Middle East, Africa, Europe, and Southeast Asia with high-quality fertilizers, petrochemicals, and industrial raw materials.
Our Global Reach
Operating at the crossroads of continents, Green Gubre Group leverages Turkey’s strategic location as a central logistics and distribution hub for fertilizer and petrochemical flows. We facilitate direct access to major fertilizer types—including granular and prilled urea, ammonia, NPK blends, DAP, MAP, and sulphur—from certified, globally recognized suppliers.
Comprehensive Sourcing and Supply
We specialize in large-scale, just-in-time sourcing of fertilizers and petrochemicals designed to meet the dynamic requirements of:
- Wholesalers and distributors
- Agri-businesses and cooperatives
- Industrial buyers and chemical processors
- Regional and international traders
Through robust partnerships with trusted producers across Europe, the Persian Gulf, North Africa, and Asia,
Green Gubre Group ensures consistent availability, competitive pricing, and traceable quality for every shipment.
Integrated Logistics and Market Intelligence
Backed by a team with deep experience in international freight, customs clearance, and risk management, we offer a complete supply chain service—from strategic procurement and contract execution, to shipping, inspection, and timely delivery to ports and inland locations throughout our trading regions.
Our trade desk continuously monitors global market movements, industry benchmarks, tender activity, and port operations, supplying clients with real-time intelligence, actionable insights, and customized market reports that enhance procurement planning and commercial success.
Commitment to Sustainability and Corporate Responsibility
Green Gubre Group is dedicated to promoting ethical, transparent trading practices and advancing sustainability across all of our operations. We prioritize responsible sourcing, environmental stewardship, and regulatory compliance, further supporting our partners’ reputations and long-term growth.
Empowering Growth, Connecting Markets
By partnering with Green Gubre Group, clients gain a trusted, resourceful ally in navigating volatile markets and complex international supply chains. Our agility, independence, and focus on value allow us to deliver optimal solutions across borders and cycles—empowering agricultural development and industrial growth wherever we operate.
Green Gubre Group | Global Fertilizer & Trade
References
- Argus Media – Nitrogen Weekly Report (July 2025)
- CRU Group – Fertilizer Week Reports (July 2025)
- Profercy Nitrogen Market Report – Week 29, July 2025
- ARMAITI Market Charts – Granular Urea, Freight & Price Data (July 2025)
- BIK Port Lineup Report – July 2025
- Indian Potash Limited – Urea Tender Announcement (July 2025)