June 2025 Global Fertilizer & Petrochemical Analysis:
Trends, Supply Challenges, and Opportunities Ahead


Author : Saman Memarpour
Introduction
The global fertilizer and petrochemical markets in June 2025 displayed a clear divergence between nitrogen-based fertilizers and phosphate-based products. While the urea and ammonia markets continued to soften, phosphates and sulphur remained resilient, supported by robust agricultural demand and constrained supply.
1. Granular Urea Price Trends Across Key Regions
Granular Urea Market Overview
In June, granular urea prices trended downward globally, reflecting oversupply and seasonal slowdown in several major importing markets. Prices were affected by substantial supply recoveries in Iran and the Middle East, reduced Indian imports, and cautious buying in Brazil and Southeast Asia.
- Middle East FOB prices decreased from 380 USD/MT to 355 USD/MT, as higher production in Qatar and Saudi Arabia increased export availability.
- Iran FOB prices softened from 370 USD/MT to 345 USD/MT, with robust output and steady vessel line-ups at Bandar Abbas, boosting supply to Brazil, Turkey, and Southeast Asia.
- Egypt FOB prices dropped to around 370–375 USD/MT, weighed down by limited European demand and stronger regional competition.
- Black Sea FOB prices fell to 340 USD/MT, amid cautious purchasing from European buyers and reduced Latin American activity.
- Brazil CFR prices eased from 430 USD/MT to 420 USD/MT, as importers paused new purchases after heavy pre-season buying in April and May.
- Turkey CFR prices declined slightly to 390–395 USD/MT, pressured by additional Iranian cargoes and domestic inventory build-up.
- Southeast Asia CFR prices ranged from 395 USD/MT to 405 USD/MT, as buyers in Vietnam, Thailand, and the Philippines reduced tender volumes and negotiated lower levels.
- West Africa CFR prices remained relatively firm, at around 410–415 USD/MT, supported by steady granular urea demand at ports such as Lomé and Abidjan.
2. Key Fertilizer Benchmarks – (USD/MT)
| Product | Early June | Late June | Change | Trend |
|---|---|---|---|---|
| Granular Urea (FOB ME) | 380 | 355 | -25 | ⬇️ Weakening |
| Prilled Urea (FOB Iran) | 360 | 340 | -20 | ⬇️ Softer |
| DAP (CFR India) | 615 | 620 | +5 | ⬆️ Firm |
| MAP (CFR Brazil) | 635 | 640 | +5 | ⬆️ Supported |
| Sulphur (FOB ME) | 170 | 175 | +5 | ⬆️ Steady |
| Ammonia (FOB ME) | 330 | 325 | -5 | ⬇️ Softening |
3. Regional Trade Highlights
- China: Continued strict export restrictions to prioritize domestic supply pushed global buyers to rely more heavily on Middle Eastern and Iranian cargoes. Domestic phosphate prices surged due to strong local demand.
- Iran: Production stabilized, leading to increased exports, especially to Brazil, Southeast Asia, and Turkey. The line-ups from Bandar Abbas showed multiple large parcels scheduled for late June and early July.
- India: The absence of a urea tender in June created uncertainty; however, strong DAP imports persisted for the monsoon planting season. Expectations for a large July tender weighed on market sentiment.
- Africa: Strong granular urea demand continued, particularly in West Africa. Nigerian and Iranian volumes filled part of this market.
- Latin America: Brazilian buyers adopted a cautious stance on urea but maintained strong MAP demand for upcoming planting. Argentina also saw moderate urea movements.
- Europe: Buyers stayed on the sidelines amid price corrections, especially in Southern and Eastern Europe.
4. Freight & Logistics
- Port congestion and longer inspection times continued to persist in Iranian ports and West African terminals.
- Freight rates remained firm, particularly on the Middle East → Brazil and Black Sea → India routes, with rates rising 4–7% month-over-month.
- Impact: CIF-based offers increased marginally, further affecting buyer appetite for new parcels.
Summary Snapshot
| Market Driver | Impact | Notes |
|---|---|---|
| Iran Production Recovery | ⬆️ Supply | Strong line-ups; stable plant operations. |
| India Tender Delay | ⬇️ Demand | Wait-and-see sentiment, weaker near-term prices. |
| China Export Controls | ⬆️ Supply | Tightened phosphate and urea availability globally. |
| Africa & LATAM Demand | ⬆️ Demand | Sustained buying for granular urea and MAP. |
| Freight & Logistics | ⬆️ Cost | Higher rates, longer discharge times globally. |
Granular and Prilled Urea Market
Granular Urea Market Overview
The granular urea market in June 2025 experienced broad-based price corrections, driven by oversupply from the Middle East and Iran, delayed procurement by India, and cautious buying from key importers in Southeast Asia, Africa, and Latin America. Despite steady agricultural demand in some regions, global sentiment remained bearish as buyers focused on minimizing inventory risk.
Deep Dive: Regional Price Developments
Middle East (Qatar, Saudi Arabia, UAE): FOB prices dropped from 380 USD/MT to 355 USD/MT, amid aggressive export offers and high production utilization rates. Producers offered competitive lots targeting Brazil, Southeast Asia, and East Africa. Saudi Arabia floated small-volume tenders (10,000–20,000 MT) to Vietnam and Malaysia to maintain market presence.
Iran: Prices declined from 370 USD/MT to 345 USD/MT FOB, driven by high production and record vessel line-ups at Bandar Abbas and Bushehr. Iranian producers successfully placed large volumes into Brazil, Turkey, Bangladesh, and the Philippines.
Brazil: CFR prices dropped from 430 USD/MT to 420 USD/MT, reflecting reduced immediate purchasing interest as buyers absorbed earlier stockpiles. MAP continued to attract more interest among local blenders due to its favorable agronomic value.
Southeast Asia (Vietnam, Thailand, Philippines, Malaysia): CFR prices ranged from 395–405 USD/MT, with Vietnamese buyers securing smaller spot parcels to mitigate price risk. Thai importers reported slow government procurement, while Philippine blenders focused on utilizing their leftover stocks from the first quarter. Malaysian traders negotiated direct sales from the Middle East and Iran to reduce costs.
- Turkey: CFR prices softened to 390–395 USD/MT, pressured by ample Iranian imports and moderate domestic demand.
- West Africa (Nigeria, Ghana, Côte d’Ivoire, Senegal): CFR prices held around 410–415 USD/MT, supported by national fertilizer subsidy programs and regional food security initiatives. Iranian and Nigerian supplies dominated, while some Egyptian parcels found their way into Côte d’Ivoire.
- East Africa (Kenya, Tanzania): Prices hovered around 415–420 USD/MT CFR, reflecting solid local demand and limited domestic blending capacity.
- Black Sea Region (Russia, Ukraine): FOB prices eased to 340 USD/MT, as European buyers slowed activity and Turkish importers leaned more heavily on Iranian prilled volumes. Some Russian granular urea moved into Morocco and North Africa, filling seasonal gaps.
- Bangladesh: Market sentiment stayed soft, with smaller state tender volumes and lower purchase price expectations (around 410 USD/MT CFR). Private importers remained cautious amid currency volatility.
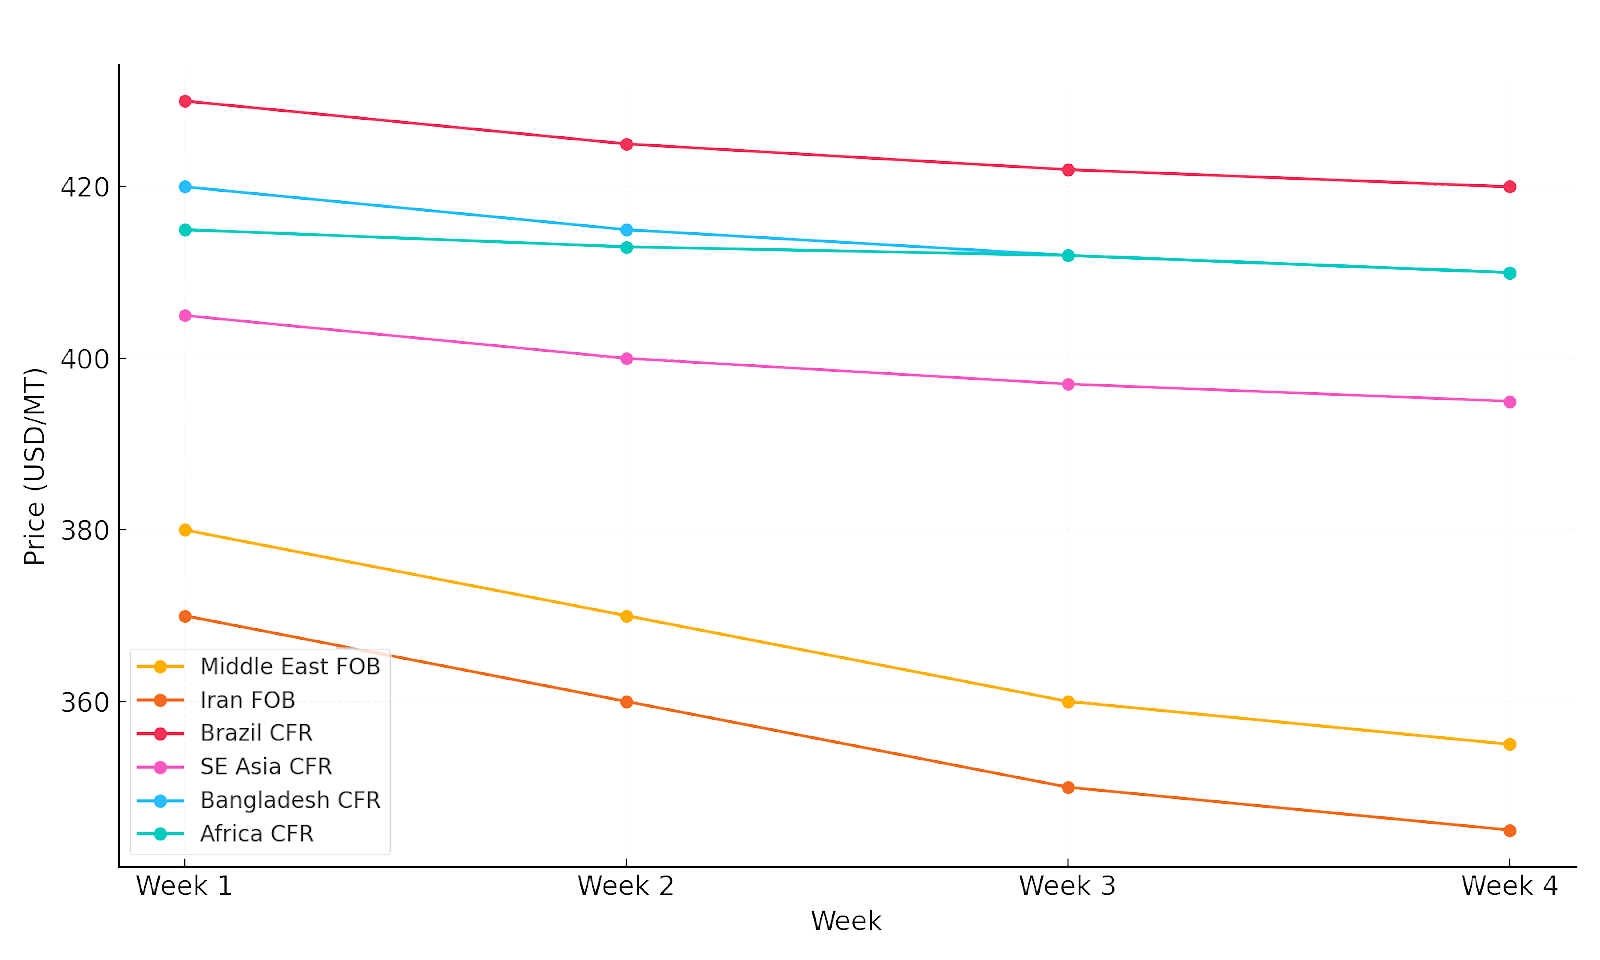
Price Trend Table (USD/MT)
| Region | Early June | Late June | Change | Trend |
|---|---|---|---|---|
| Middle East FOB | 380 USD/PMT | 355 USD/PMT | -25 | ⬇️ Weak |
| Iran FOB | 370 USD/PMT | 345 USD/PMT | -25 | ⬇️ Weak |
| Brazil CFR | 430 USD/PMT | 420 USD/PMT | -10 | ⬇️ Soft |
| SE Asia CFR | 405 USD/PMT | 395 USD/PMT | -10 | ⬇️ Soft |
| Turkey CFR | 400 USD/PMT | 390 USD/PMT | -10 | ⬇️ Weak |
| West Africa CFR | 415 USD/PMT | 410 USD/PMT | -5 | ➖ Firm |
| East Africa CFR | 420 USD/PMT | 415 USD/PMT | -5 | ➖ Firm |
| Black Sea FOB | 350 USD/PMT | 340 USD/PMT | -10 | ⬇️ Soft |
| Bangladesh CFR | 420 USD/PMT | 410 USD/PMT | -10 | ⬇️ Soft |
Bulk Export Tender Intelligence
June saw a reduction in mega-size tenders, with most suppliers preferring to offer smaller lots to maintain flexibility. Iran floated multiple tenders of 30,000–50,000 MT, targeting Brazil, Turkey, and Bangladesh, which were often negotiated on a private basis. Middle Eastern producers offered granular lots of 20,000–30,000 MT to Southeast Asia, focusing on Vietnam and Malaysia due to stronger spot demand.
Market Fundamentals
The
granular urea market in June 2025 was shaped by a combination of structural supply factors, shifting seasonal demand, and geopolitical trade dynamics:
Weekly Price Comparison Chart
- High Global Production Capacity: Robust output levels in the Middle East (Saudi Arabia, Qatar, UAE) and Iran continued to flood export markets. Iranian plants operated steadily after overcoming early-year gas supply disruptions, contributing significant volumes to global supply.
- Absence of Indian Buying: India, traditionally a major granular urea importer, stayed out of the market in June, delaying its anticipated tender. This strategic pause caused surplus cargoes to be redirected toward Latin America, Southeast Asia, and Africa, putting additional downward pressure on prices.
- Southeast Asian Demand Moderation: Countries such as Vietnam, Thailand, and the Philippines reduced their tender volumes and switched to smaller spot purchases. The slowdown reflected efforts to manage inventory risk amid fluctuating currencies and volatile freight rates.
- African Government Subsidies: West African nations, including Nigeria, Ghana, and Côte d’Ivoire, maintained strong demand due to ongoing fertilizer subsidy programs. However, buyers became more price-sensitive as global prices softened.
- Currency Volatility and Financial Constraints: The weakening of local currencies in Southeast Asia and Latin America reduced the purchasing power of importers, leading to delays and smaller shipment commitments.
- Freight Market Impact: Elevated freight rates and port congestion (especially in West Africa and parts of Southeast Asia) increased delivered (CFR) prices, creating discrepancies between FOB and CFR market signals.
Market Outlook
The expected large Indian tender in early July could absorb some excess supply and temporarily support prices. Nonetheless, the overall outlook remains bearish due to aggressive offers from Middle Eastern and Iranian suppliers, robust production, and pressure on the freight market. Southeast Asia and Africa are likely to remain key demand centers, albeit at more conservative volume levels.
Prilled Urea Market Overview
The prilled urea market also experienced downward momentum in June but was relatively less volatile than granular urea due to its niche usage and smaller market share.
Deep Dive: Regional Price Developments
- Iran: Prices fell from 360 USD/MT to 340 USD/MT FOB, supported by continued strong production and stable loadings. Main destinations included Turkey, Bangladesh, Vietnam, and select East African markets (Kenya and Tanzania).
- Baltic & Black Sea: Prices dropped to 330–340 USD/MT FOB, with limited demand from Europe and increasing reliance on minor cargoes to North Africa and Turkey.
- China: Export activity remained minimal as authorities continued to prioritize domestic supply through tight quotas. Local prices stayed higher to support domestic agricultural programs.
- Turkey: CFR prices eased to 380 USD/MT, as domestic stocks and Iranian prilled imports dampened buying interest.
- Southeast Asia: Prices slipped to 385–390 USD/MT CFR, with Vietnam and Thailand focusing on government tenders rather than spot cargoes.
- East Africa: Smaller volumes of prilled urea (mainly from Iran) reached Kenya and Tanzania, with prices in the 390–400 USD/MT CFR range, reflecting high logistical costs and localized demand.
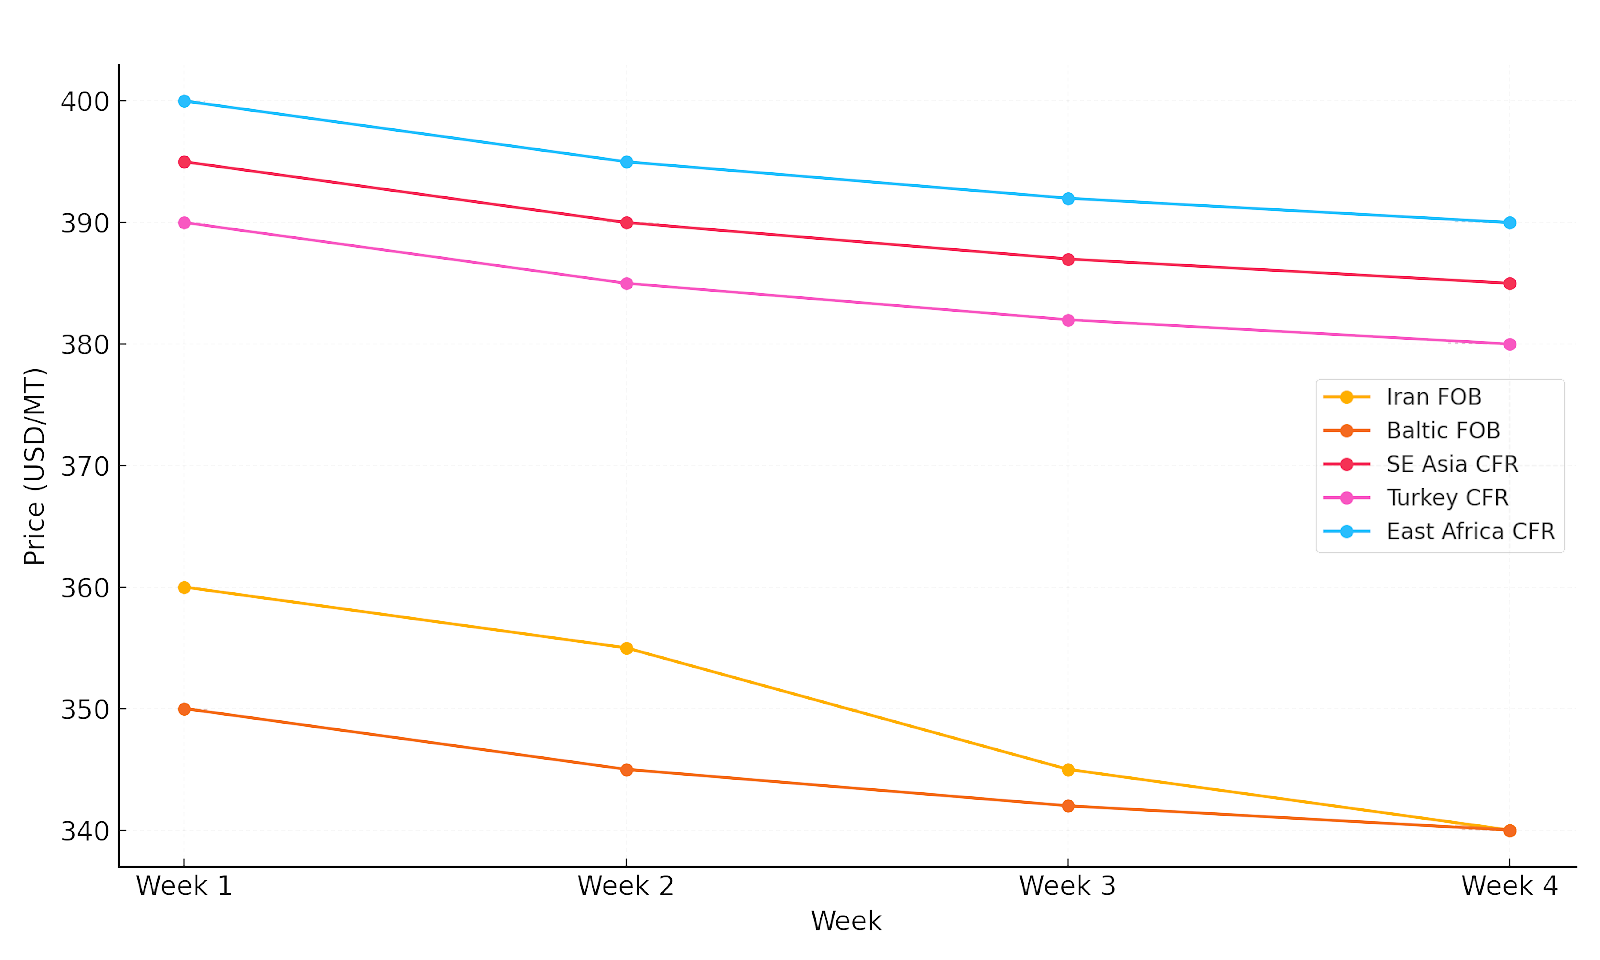
Price Trend Table (USD/MT)
| Region | Early June | Late June | Change | Trend |
|---|---|---|---|---|
| Iran FOB | 360 | 340 | -20 | ⬇️ Soft |
| Baltic FOB | 350 | 340 | -10 | ⬇️ Soft |
| SE Asia CFR | 395 | 385 | -10 | ⬇️ Soft |
| Turkey CFR | 390 | 380 | -10 | ⬇️ Weak |
| East Africa CFR | 400 | 390 | -10 | ⬇️ Soft |
Weekly Prilled Urea Price Comparison Chart
(June 2025)
Bulk Export Tender Intelligence
Iran remained the most active prilled urea exporter, issuing several private tenders in the 10,000–20,000 MT range. Russian sellers largely favored long-term contractual sales in Eastern Europe and North Africa over open tenders.
Market Fundamentals
Somewhat different supply-demand dynamics drive the prilled urea market fundamentals:
- Niche Application & Regional Preferences: Prilled urea is preferred in certain markets for specific agronomic practices (e.g., broadcasting in rice fields in Southeast Asia). Demand is inherently smaller and more targeted, resulting in lower price volatility compared to granular urea.
- Iran & Russia as Dominant Suppliers: Iran remains the leading global exporter of prilled urea, with consistently strong production levels. Russian volumes focused on Eastern Europe and select North African markets, providing an alternative to Middle Eastern granular cargoes.
- China’s Strict Export Controls: Chinese prilled urea exports remained minimal due to stringent government controls aimed at securing the domestic supply. These restrictions helped support regional prices and diverted demand to Iran and Baltic suppliers.
- Flexible Logistics Advantage: Prilled urea’s smaller, lighter granule size facilitates easier storage and blending, especially in markets with less advanced infrastructure (e.g., parts of East Africa, Southeast Asia).
- Seasonality and Strategic Stocking: Buyers in Vietnam, Thailand, and Bangladesh strategically timed prilled urea purchases in anticipation of Q3 planting. However, cautious procurement strategies persisted amid softer price signals and ample availability.
Market Outlook
The prilled urea market is likely to stay under pressure through early Q3, with any potential support depending on India’s buying activity and tightening Chinese export policy. Iran and Russia are expected to remain dominant suppliers, targeting smaller niche markets rather than large-volume tenders.
Ammonia Market
Ammonia Market Overview
The global ammonia market in June 2025 continued its downward correction, pressured by a combination of high production levels in the Middle East and North Africa, slow buying activity in Asia, and subdued industrial demand in Europe.
Deep Dive: Regional Price Developments
- Middle East (Saudi Arabia, Qatar): FOB prices dropped from 330 USD/MT to 325 USD/MT by late June. At the same time, regional producers maintained high operating rates, while lower spot inquiries from Asia and Europe capped the potential price. Saudi producers prioritized term customers but also actively floated small spot parcels to South Asia.
- North Africa (Algeria, Egypt): FOB prices held around 450 USD/MT, supported by limited spot availability and strong term contract deliveries to European buyers. Algeria’s supply remained steady, while Egypt redirected some ammonia volumes to domestic downstream industries (e.g., urea, nitrates).
- Southeast Asia (Vietnam, Indonesia, Thailand): CFR prices ranged from 420 to 430 USD/MT, as industrial ammonia buyers operated at reduced rates amid weaker downstream chemical margins. Importers in Vietnam and Thailand continued to take minimal volumes, focusing on balancing stock levels.
- Europe (Northwest Europe): CFR prices decreased to 440–450 USD/MT, reflecting weak local fertilizer production and lower off-season industrial consumption. Some buyers reported delaying or renegotiating shipments amid rising storage costs.
- US Gulf: CFR prices softened slightly to 450 USD/MT, despite stable industrial ammonia consumption. High freight costs and competitive offers from Middle Eastern suppliers pressured importers to negotiate lower prices.
- South Asia (India, Bangladesh): India largely remained absent from the spot ammonia market, awaiting price stabilization before new purchases. Bangladesh maintained some small contractual volumes, priced around 440–445 USD/MT CFR.
- East Asia (South Korea, Japan): Industrial users maintained cautious buying at 420–425 USD/MT CFR, with cracker margins squeezed and some buyers deferring shipments.
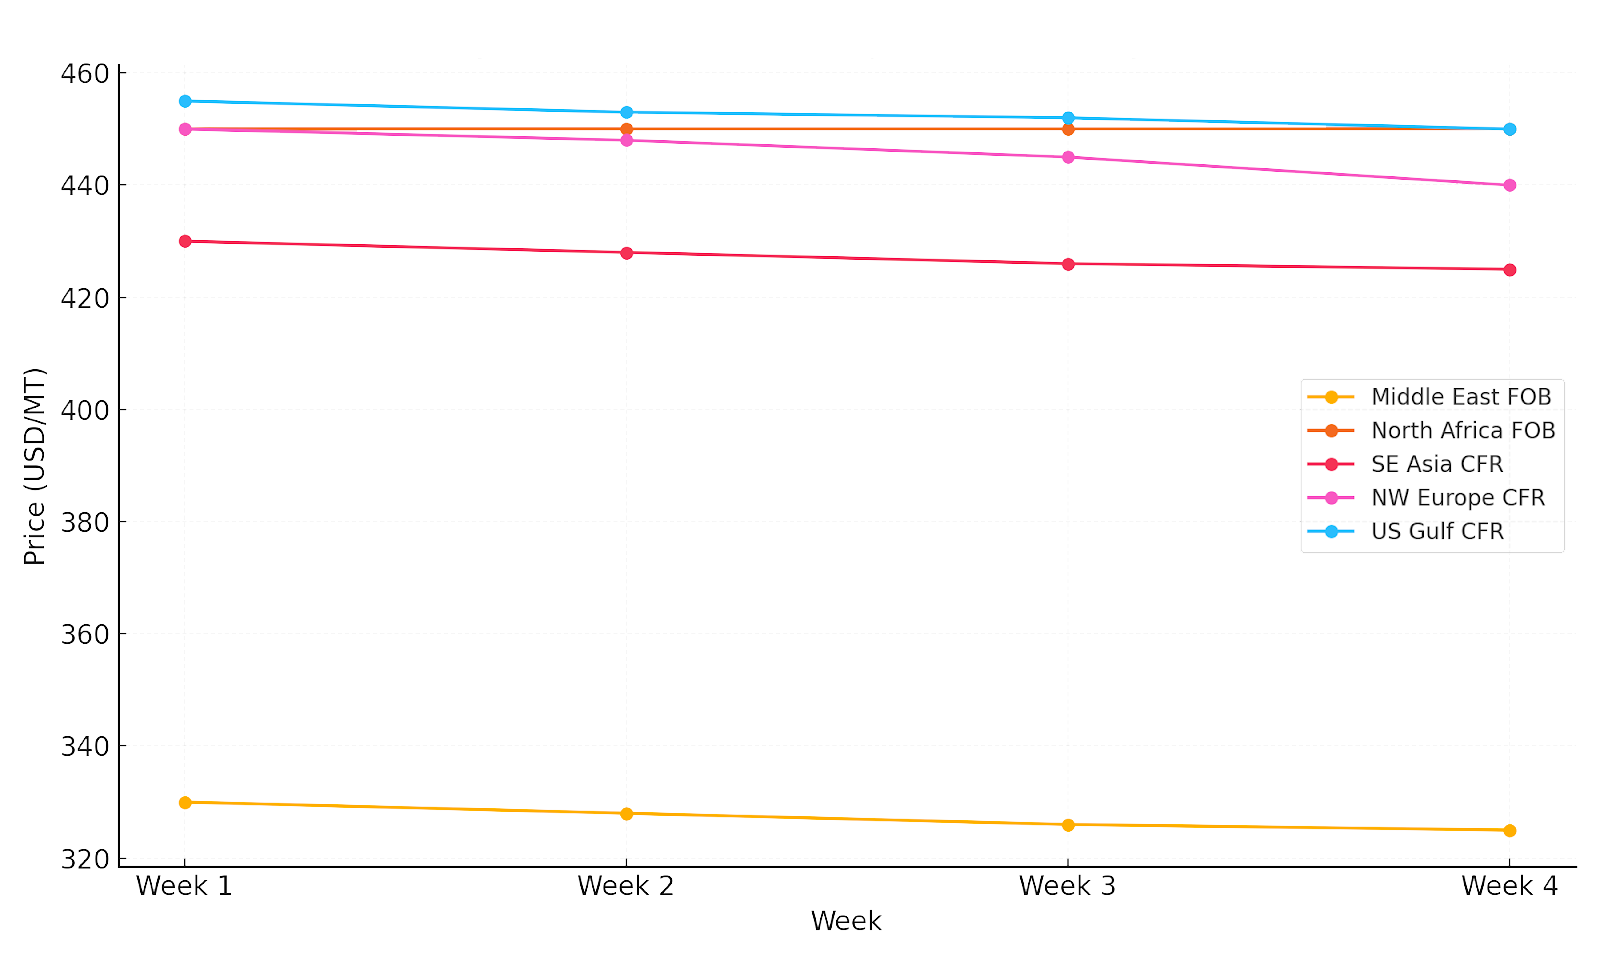
Price Trend Table (USD/MT)
| Region | Early June | Late June | Change | Trend |
|---|---|---|---|---|
| Middle East FOB | 330 | 325 | -5 | ⬇️ Soft |
| North Africa FOB | 450 | 450 | - | ➖ Firm |
| SE Asia CFR | 430 | 425 | -5 | ⬇️ Soft |
| NW Europe CFR | 450 | 440 | -10 | ⬇️ Weak |
| US Gulf CFR | 455 | 450 | -5 | ⬇️ Soft |
| South Asia CFR | 445 | 440 | -5 | ⬇️ Soft |
| East Asia CFR | 425 | 420 | -5 | ⬇️ Soft |
Market Fundamentals
- High Operating Rates: Middle Eastern and North African plants continued to operate at high rates, contributing to global oversupply.
- Weak Industrial Demand: European and Asian industrial buyers operated at reduced capacity due to squeezed margins in derivatives (e.g., acrylonitrile, caprolactam).
- Limited New Buying from India: India has avoided new ammonia purchases, focusing instead on finished fertilizers and balancing domestic production.
- Freight Pressure: Elevated shipping costs and port delays influenced delivered price negotiations, pushing CFR offers higher relative to FOB.
Market Outlook
Looking into early Q3 2025:
- Prices are expected to remain under pressure without primary new demand triggers.
- Possible support may come from Asian industrial restarts or unexpected supply outages.
- Aggressive Middle Eastern offers are likely to continue, targeting South Asia and Southeast Asia.
- European demand is projected to remain muted during the summer off-season.
Weekly Ammonia Price Comparison Chart(June2025)
Bulk Export Tender Intelligence
June saw muted tender activity for ammonia exports. Middle Eastern suppliers focused on smaller, flexible parcels (5,000–10,000 MT) to South Asia and Southeast Asia. North African producers primarily fulfilled term contracts and avoided major spot tenders.
Spot parcels from the Middle East were often priced at competitive discounts to secure quick sales, given the limited appetite in the West.
NPK Market
NPK Market Overview
The global NPK (compound fertilizer) market in June 2025 demonstrated resilience, driven by strong agronomic demand in Africa and Latin America, as well as steady consumption in Southeast Asia. Despite softer nitrogen prices globally, the firmness in potash and phosphate prices provided underlying price support for NPK formulations.
Deep Dive: Regional Market Developments
- West Africa (Nigeria, Ghana, Côte d’Ivoire): Strong fertilizer subsidy programs and pre-planting demand drove CFR prices up to 580 USD/MT, compared to 570 USD/MT at the beginning of the month. National food security priorities and expanded state tenders supported robust import volumes.
- East Africa (Kenya, Tanzania): Prices firmed from 570 to 590 USD/MT CFR, supported by ongoing government procurement and donor-supported agricultural programs. Regional blenders continued to rely on direct imports from Morocco and Russia.
- Brazil & LATAM: Brazilian CFR prices rose to 590 USD/MT, reflecting increased pre-season stock building for Q3 planting. MAP and potash price trends also contributed to firmer compound fertilizer costs. Argentina and Paraguay showed moderate activity, focusing on customized blends for sugarcane and corn.
- Southeast Asia (Vietnam, Philippines, Indonesia): Prices increased from 585 to 600 USD/MT CFR, with importers managing limited tender volumes. Vietnamese traders reported a preference for flexible shipments, while Indonesian buyers focused on small-volume bookings amid currency pressures.
- Eastern Europe (Ukraine, Romania, Bulgaria): CFR prices rose slightly to 560 USD/MT, reflecting moderate seasonal uptake and reliance on regional Russian and Baltic supply.
- China: Export restrictions continued to curb Chinese compound fertilizer flows, supporting domestic prices and limiting global availability.
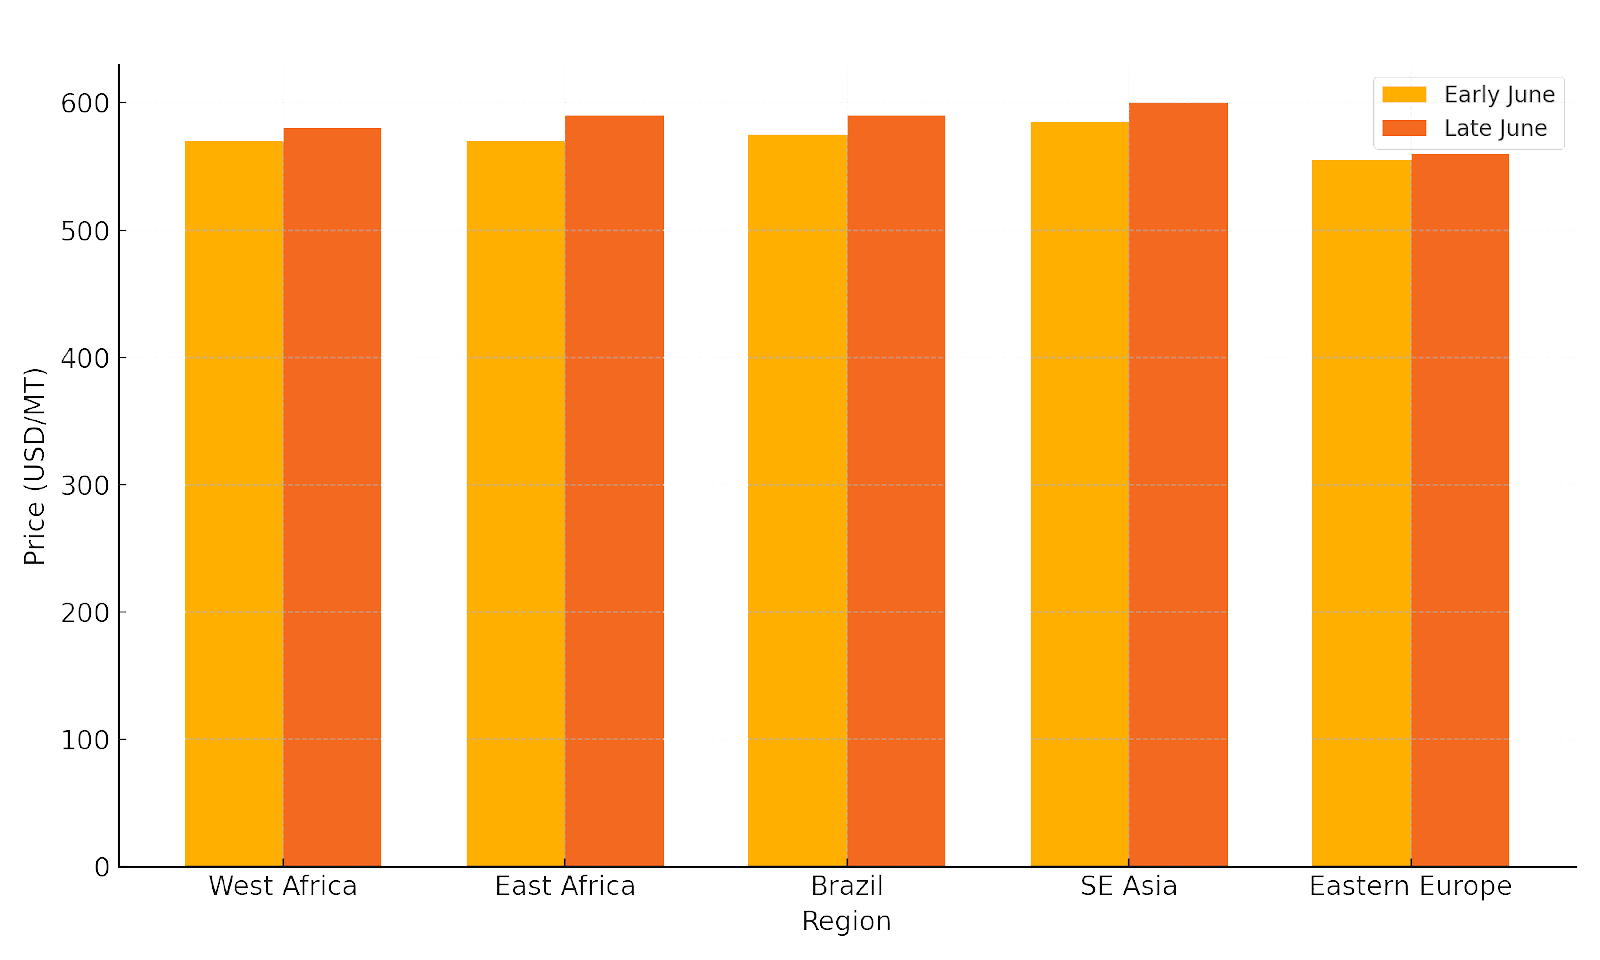
Price Trend Table (USD/MTa
| Region | Early June | Last Name | Change | Trend |
|---|---|---|---|---|
| West Africa CFR | 570 | 580 | +10 | ⬆️ Firm |
| East Africa CFR | 570 | 590 | +20 | ⬆️ Firm |
| Brazil CFR | 575 | 590 | +15 | ⬆️ Firm |
| SE Asia CFR | 585 | 600 | +15 | ⬆️ Supported |
| Eastern Europe CFR | 555 | 560 | +5 | ➖ Stable |
CFR Price Range by Region Chart
Market Fundamentals
- Firm Potash and Phosphate Inputs: Global potash and phosphate prices remained strong, offsetting the softness in nitrogen, and maintaining NPK pricing stability.
- Regional Support Programs: Strong subsidy frameworks in West and East Africa, along with forward purchasing in Brazil, underpinned steady CFR levels.
- Limited Chinese Exports: Tight export controls from China restricted global supply, adding further support to market prices.
- Freight and Currency Headwinds: Elevated shipping rates and weakening regional currencies discouraged large-scale speculative buying, but did not significantly impact structural demand.
Bulk Export Tender Intelligence
- Russian and Moroccan producers led multiple small-lot tenders (5,000–15,000 MT) to Africa and Southeast Asia.
- Brazilian blenders secured flexible laycans for Q3, focused on higher potash formulations.
- Some delayed African tenders were reactivated in late June, which boosted demand in the latter part of the month.
CFR Price Range by Region Chart
Regional Market Highlights
West Africa (Nigeria, Ghana, Côte d’Ivoire)
West Africa remained a critical growth hub for NPK demand in June 2025. National fertilizer subsidy programs and strong governmental support for local agriculture ensured robust import activity despite high freight rates. Nigeria maintained large tenders for 15-15-15 and 20-10-10 blends, while Ghana and Côte d’Ivoire focused on supporting cocoa and staple food production. Prices rose to around 580 USD/MT CFR, as local distributors prioritized guaranteed supply over price.
East Africa (Kenya, Tanzania, Uganda)
East Africa recorded solid NPK import volumes, driven by concerns over food security and support from international organizations. Kenya’s government-led fertilizer distribution programs drove sustained demand, with particular focus on maize and tea production. Prices firmed to 590 USD/MT CFR, supported by a mix of Moroccan and Russian supply sources. Tanzania also reported strong engagement in regional fertilizer hubs, such as Dar es Salaam.
Brazil & Latin America
In Brazil, intense preparations for Q3 planting saw CFR prices rise to 590 USD/MT. Domestic blenders prioritized high-phosphorus and potash formulations to meet the specific nutrient needs of crops such as soybeans and corn. Argentina and Paraguay maintained moderate import volumes, focusing on targeted blends such as 20-20-0 and 04-14-08, critical for sugarcane and specialty crops.
Southeast Asia (Vietnam, Indonesia, Philippines)
Southeast Asian markets faced mixed dynamics. In Vietnam, importers favored flexible shipment schedules and smaller parcels to manage currency risk. Indonesian buyers slowed major bookings but maintained small tenders to support rice and palm oil production. In the Philippines, local cooperatives worked to stabilize farmgate prices through timely NPK imports, supporting prices at 600 USD/MT CFR.
Eastern Europe (Ukraine, Romania, Bulgaria)
In June, Eastern Europe saw cautious procurement strategies as buyers relied on existing stocks and regional supply sources. Prices edged up to 560 USD/MT CFR, supported by proximity to Russian and Baltic supply channels. Romanian buyers focused on spring and early summer application programs, while Ukrainian importers adjusted schedules due to logistic disruptions in the Black Sea.
China
Chinese exporters remained largely absent from the international NPK market due to strict export restrictions aimed at ensuring domestic food security. This policy maintained strong domestic prices and indirectly supported global price levels by tightening supply availability.
North Africa
Although not a primary NPK importer, select North African markets, including Morocco and Algeria, maintained regional sales to sub-Saharan Africa. Moroccan producers, in particular, leveraged proximity and phosphate advantage to fill short-notice tenders in West Africa.
Summary Snapshot Table
| Region | June 2025 Demand Trend | Price Impact | Main Drivers |
|---|---|---|---|
| West Africa | Strong | ⬆️ Firm | Subsidies, food security, tender activity |
| East Africa | Robust | ⬆️ Firm | State-led programs, donor support |
| Brazil & LATAM | Strong | ⬆️ Supported | Pre-season blending, crop diversification |
| SE Asia | Moderate | ⬆️ Stable | Currency caution, targeted tenders |
| Eastern Europe | Cautious | ➖ Stable | Stock reliance, local supply proximity |
| China | Limited export | ⬆️ Support | Domestic supply priority |
Market Outlook
Heading into Q3 2025:
- NPK prices are likely to remain firm, supported by ongoing African subsidies and Brazilian pre-season demand.
- Freight and currency risks will continue to shape buying strategies, especially in Southeast Asia and Latin America.
- A potential easing of Chinese restrictions would be the main risk to sustained price strength, but it remains unlikely in the short term.
Freight and Logistics
Global Freight Market Overview
In June 2025, the global fertilizer and petrochemical freight market continued to face pressure from persistently high rates and operational bottlenecks at key export and import ports. Despite some easing in spot demand for urea and ammonia, strong shipments of NPK and phosphate kept vessel utilization firm. Port congestion in Iran, West Africa, and Southeast Asia, coupled with rising fuel costs, contributed to higher freight rates on most routes.
Estimated Freight Rates – Key Routes (June 2025)
| Route | Estimated Rate (USD/MT) |
|---|---|
| Middle East → Brazil | 55-58 |
| Middle East → West Africa | 40-45 |
| Black Sea → India | 35-38 |
| Iran → Southeast Asia | 35-40 |
| North Africa → Europe | 25-28 |
| Baltic → Latin America | 55-60 |
Rates remained elevated relative to historical averages, reflecting limited vessel availability and continued high bunker fuel prices.
Regional Logistics Highlights
- Middle East & Iran: Port congestion persisted at Bandar Abbas and Saudi Arabian terminals, with more extended laycan periods (up to 12–14 days). These are the delayed shipments of both granular and prilled urea.
- West Africa: Limited storage and poor port infrastructure in Lagos, Abidjan, and Lomé caused frequent delays, forcing some buyers to pay premium demurrage charges.
- Southeast Asia: Importers in Vietnam and the Philippines faced long berthing queues, partly due to early monsoon disruptions and tight inspection schedules.
- Brazil: Robust pre-season fertilizer imports strained discharge capacity at Santos and Paranaguá ports, leading to extended turnaround times.
- Eastern Europe: Black Sea logistics remained fluid but cautious. Operators maintained a conservative schedule, taking into account geopolitical risks and periodic security inspections.
Freight Rate Trends – Supramax Segment (May vs. June 2025)
| Region | May 2025 (USD/MT) | June 2025 (USD/MT) | Change |
|---|---|---|---|
| Middle East → Brazil | 58 | 56 | +4 |
| Middle East → West Africa | 38 | 42 | +4 |
| Black Sea → India | 32 | 36 | +4 |
| Iran → SE Asia | 33 | 37 | +4 |
Supramax freight rates increased by 7–12% month-over-month, driven by tight vessel supply and continued strong demand for fertilizer cargoes.
Outlook for Q3 2025
- Global freight rates are expected to remain elevated through July and August, supported by active fertilizer programs in Africa and Brazil.
- Continued high bunker costs and ongoing port inefficiencies will likely prevent a meaningful drop in freight prices in the short term.
- Regional tensions in the Black Sea could further disrupt eastbound routes if escalated.
Key Segment Forecasts
- Supramax & Handymax: Tight supply to continue; high utilization expected for fertilizer and grain movements.
- Panamax: Strong support from agricultural cargoes, including grain and bulk fertilizer shipments from the US Gulf and Brazil.
- Handysize: Flexible repositioning in Southeast Asia and East Africa is expected to remain in high demand for smaller-volume fertilizer contracts.
Regional Drivers to Watch
| Factor | Possible Impact |
|---|---|
| African Subsidy Programs | Sustain vessel utilization in West Africa |
| Brazilian Pre-Season Demand | Prolonged port congestion and high rates |
| Black Sea Stability | Affect the supply chain and rate volatility |
| Fuel Price Fluctuations | Direct cost impact on freight rates |
| Southeast Asian Weather | Delay shipments, elevate premiums |
Conclusion – June 2025 Fertilizer & Petrochemical Market Report
Key Takeaways
- Nitrogen-based fertilizers faced broad price corrections, driven by oversupply from Iran and the Middle East, weak spot demand in Southeast Asia, and the absence of Indian tenders. Both granular and prilled urea prices softened globally, with significant declines across major import hubs.
- Ammonia markets continued to soften, with FOB and CFR prices down across all key regions. High production rates in the Middle East and North Africa, alongside reduced industrial and fertilizer demand in Europe and Asia, weighed heavily on market sentiment.
- Phosphate and NPK markets remained resilient, supported by strong agronomic demand in Africa and Latin America, as well as sustained forward purchases in Brazil. Limited Chinese exports and firm potash prices provided additional support to prices.
- Sulphur and phosphate prices held firm, reflecting steady demand for compound fertilizer production and constrained global supply.
- Freight and logistics costs remained elevated, driven by strong demand for vessel space in Africa and Latin America, ongoing port congestion, and high bunker fuel prices. Supramax rates rose across key fertilizer routes, adding further cost layers for CFR buyers.
Strategic Implications for July
- India’s anticipated major urea tender in early July is expected to temporarily absorb surplus granular and prilled urea, potentially stabilizing prices and offering some upside momentum. Suppliers should prepare strategically to capture this opportunity.
- Middle Eastern and Iranian exporters are likely to continue employing aggressive pricing strategies, maintaining pressure on global nitrogen markets. Buyers may leverage this for favorable spot negotiations before any price rebounds.
- Brazilian pre-season purchases are set to continue, driving sustained demand for NPK and phosphate products through July and August. Producers targeting Latin America should focus on timely logistics planning and premium service offerings to secure market share.
- African subsidy programs will support firm import volumes, though price sensitivity will remain critical as freight rates stay high. Suppliers should closely monitor regional tender schedules.
- Freight market pressures are expected to persist, particularly on the Middle East to Brazil and Black Sea to India routes. Importers should factor in higher CFR costs when planning procurement and cash flow.
- Geopolitical risks, particularly in the Black Sea and Suez Canal transit routes, may further impact logistics and lead to price volatility. Stakeholders should remain vigilant and consider implementing hedging strategies.
- Profercy Nitrogen Report Week 26 – 26 June 2025
- FMB Ammonia Report – 5 June 2025
- FMB Nitrogen Report – 5 June 2025
- FMB Ammonia Report – 26 June 2025
- FMB Nitrogen Report – 26 June 2025
- APAG Fertilizer Market Update – June 2025
- Acuity Briefing Sulphur – February 2025
- Iran Urea Weekly Line-up Reports – June 2025
- BND Vessel Line-up Data – June 2025
- Global Fertilizer Freight Report – June 2025