July 2026 Global Fertilizer & Petrochemical Market Report
July 2026 fertilizer and petrochemical market report covering urea, ammonia, sulfur, phosphates, potash, NPK, methanol, freight, regional trade flows and the August–September outlook.
Author: Saman Memarpour
Executive Summary
July signal: The market was defined less by nominal production capacity than by executable supply: cargoes that could be financed, insured, moved and delivered through disrupted trade corridors.
Granular urea strengthened sharply during the month. The midpoint of the Persian Gulf FOB assessment increased from USD 372.5/metric ton on 2 July to USD 450/metric ton on 30 July, while Brazil CFR rose from USD 407.5/metric ton to USD 480/metric ton. Ammonia moved in the opposite direction: Middle East FOB declined from USD 680/metric ton to USD 560/metric ton, with East Asia and US Gulf assessments also easing. Sulfur remained exceptionally elevated, sustaining cost pressure through phosphate value chains.
| Market | July direction | Verified anchor | Implication |
|---|---|---|---|
| Granular urea | Higher | Persian Gulf FOB midpoint: 372.5 → 450 | Supported by India, regional risk and freight |
| Ammonia | Lower | Middle East FOB: 680 → 560 | Supply rebalancing outweighed cost pressure |
| Sulphur | High, slightly softer | Middle East FOB: 890–1,000 → 850–900 | Phosphate cost pressure remained severe |
| Potash | Balanced to firm | 2026 shipments forecast: 74–77 million | Demand constructive; no verified July weekly spot curve |
| Methanol | Wide regional dispersion | USD 525–1,480 posted prices | Feedstock and contract structures diverged |
| Freight | Elevated/fragmented | Persian Gulf execution risk | Delivered values increasingly origin-specific |
Executive priorities
- Protect supply-chain optionality across origin, vessel class and route.
- Use staggered procurement for volatile nitrogen and sulfur-linked products.
- Separate commodity price, freight, insurance and financing in landed-cost decisions.
- Maintain normal potash coverage but avoid unsupported spot assumptions.
- Track executable availability, not only announced production.
How to read the July market
July did not produce a single, uniform fertilizer cycle. Urea strengthened while ammonia weakened; sulfur remained historically expensive; phosphate replacement costs stayed supported; and potash displayed relative stability. These divergent outcomes show why a portfolio view is essential: the same geopolitical event can raise freight and insurance costs, restrict one product’s availability and simultaneously weaken another product if downstream demand is insufficient.
The report therefore separates observed benchmark movements from analytical interpretation. Observed values are tied to a stated product, origin, incoterm and date. Market conclusions combine those observations with production economics, purchasing behavior, logistics and public company guidance. This distinction is particularly important for products such as NPK and potash, for which a complete, licensed weekly July curve was not supplied.
Cross-market transmission channels
- Natural gas affects the economics of ammonia and nitrogen production, with the greatest exposure in marginal-cost regions.
- Sulfur affects sulphuric acid, phosphoric acid, DAP, MAP and phosphate-rich compound fertilizers.
- Freight and insurance affect the delivered value of every imported nutrient, but the magnitude differs by origin and vessel class.
- Interest rates, foreign exchange and grower credit influence the timing of purchases even when agronomic demand remains intact.
- Geopolitical disruption changes the availability of executables faster than nameplate production capacity.
Management interpretation of the month
The most important management lesson is that price direction alone is insufficient for decision-making. A rising benchmark can still represent a better purchase if freight capacity is disappearing. In contrast, a falling benchmark can remain commercially unattractive if the cargo is delayed, poorly financed or exposed to sanctions and insurance risk. July repeatedly demonstrated that timing, origin and contractual execution can outweigh a narrow comparison of headline values.
A second lesson is that nutrient markets must be evaluated as a connected system. High sulfur costs can support phosphates even while ammonia falls. High urea can increase the nitrogen component of NPK, but stable potash may limit the overall increase in balanced grades. Expensive freight can widen regional spreads without changing factory economics. The report therefore uses a value-chain approach rather than treating each product as an isolated commodity.
A third lesson concerns data quality. The earlier working chapters contained several illustrative series and directional assumptions that were useful for discussion but not sufficiently verified for publication. The final report retains the analytical reasoning behind those sections while removing figures that could not be reconciled with supplied reports or authoritative public disclosures.
Macroeconomic and Energy Context
The IMF’s July 2026 update projected global growth of 3.0% in 2026 and 3.4% in 2027. The outlook remained uneven: energy importers carried a larger burden from the Middle East shock, while energy exporters and technology-linked economies were relatively better positioned. EIA’s July outlook expected US natural-gas inventories to remain above the five-year average for much of the forecast and Henry Hub prices to average close to USD 3.60/MMBtu over 2026–27.
| Indicator | Verified value | Commercial relevance |
|---|---|---|
| Global GDP growth, 2026 | 3.0% | Slower but resilient demand backdrop |
| Global GDP growth, 2027 | 3.4% | Partial recovery |
| World trade volume growth, 2026 | 3.5% | Trade rerouting remains material |
| Henry Hub, 2026–27 average | About USD 3.60/MMBtu | Supports North American nitrogen competitiveness |
Competitive map: Low-cost gas retains strategic value for US and selected Middle Eastern/North African producers; European nitrogen economics remain more exposed to marginal gas and carbon costs.
Energy geography and producer competitiveness
Ammonia and urea are globally traded products, but their cost curves are regional. Producers with reliable access to competitively priced natural gas can remain profitable at values that place pressure on plants exposed to higher hub prices, carbon costs or curtailment risk. North American producers benefited from comparatively low Henry Hub economics, while European producers remained more sensitive to short-term gas volatility and import parity.
The commercial consequence is a persistent shift in trade incentives. When European production costs rise, imports become more attractive and regional prices become increasingly linked to freight, port capacity and replacement timing. Conversely, high shipping risk can temporarily protect local producers even when their underlying manufacturing economics are weaker.
Macroeconomic demand effects
Fertilizer demand is agricultural and therefore less directly cyclical than many industrial commodities, but macroeconomic conditions still matter. Higher interest rates increase the cost of carrying inventory for importers, distributors and farmers. Currency depreciation raises local-currency fertilizer costs in import-dependent markets. Weak crop prices can lead growers to delay purchases, reduce application rates or favor nutrients with the strongest immediate yield response.
The IMF outlook suggested continued global expansion rather than a broad recession. That background supports baseline nutrient consumption, but the distribution of growth matters: energy-importing economies and financially constrained agricultural markets face a greater affordability challenge than energy exporters or countries with stronger fiscal support.
Oil, gas and fertilizer margins
Crude oil affects fertilizer markets through refinery operating rates, sulfur recovery, bunker fuel and producer-country revenues. Natural gas plays a more direct role because it is the feedstock for conventional ammonia production. A rise in oil prices does not automatically raise nitrogen production costs, but it can increase ocean freight and support sulfur availability if refinery throughput increases. The direction and timing of these effects can differ.
The spread between fertilizer values and the full cost of gas, conversion, carbon, freight, and financing determines producer margins. European plants may curtail when import parity falls below marginal production cost. North American and selected Middle Eastern producers can remain competitive at lower global values, but they are still exposed to plant reliability and export logistics. This creates a cost curve that is global in trade but regional in production.
For procurement, energy monitoring should focus on relevant hubs and time horizons. Spot Henry Hub, TTF, or JKM values may not match a producer’s hedged or contractual feedstock cost. The analytical objective is not to predict a single gas price but to understand which producers are likely to run, curtail, or redirect volumes as energy conditions change.
Agricultural affordability framework
Fertilizer affordability is the relationship between nutrient costs and expected crop revenue, adjusted for credit and currency risk. A farmer may face rising USD fertilizer benchmarks, a weaker local currency, and lower crop prices simultaneously. Conversely, strong crop margins can sustain demand even when fertilizer prices are high. This is why Brazilian, Indian, North American, and Southeast Asian buying patterns cannot be explained by commodity prices alone.
Nitrogen is generally the least deferrable nutrient because it has an immediate effect on yield and cannot be mined from soil indefinitely. Phosphate and potash applications may be delayed for a season where soil reserves permit, but repeated under-application damages long-term productivity. Government subsidies, food-security policies, and distributor finance can reduce the short-term price response in demand.
The appropriate monitoring set includes crop futures, farm-gate prices, local currency, interest rates, subsidy rules, soil nutrient conditions, weather and planted area. These indicators should be reviewed with fertilizer replacement costs to determine whether demand is being destroyed, delayed or merely shifted between products.
Nitrogen Market
The nitrogen complex strengthened unevenly. Urea recorded the clearest upward move, while ammonium sulfate and nitrate markets remained region-specific. India’s buying interest, uncertainty around Chinese exports, Brazilian demand and Persian Gulf logistics created a firm late-month tone.
| Assessment date | Persian Gulf FOB range | Midpoint | Brazil CFR range | Midpoint |
|---|---|---|---|---|
| 2 Jul | 360–385 | 372.5 | 400–415 | 407.5 |
| 16 Jul | 400–435 | 417.5 | 435–450 | 442.5 |
| 23 Jul | 440–460 | 450.0 | 465–480 | 472.5 |
| 30 Jul | 440–460 | 450.0 | 465–495 | 480.0 |
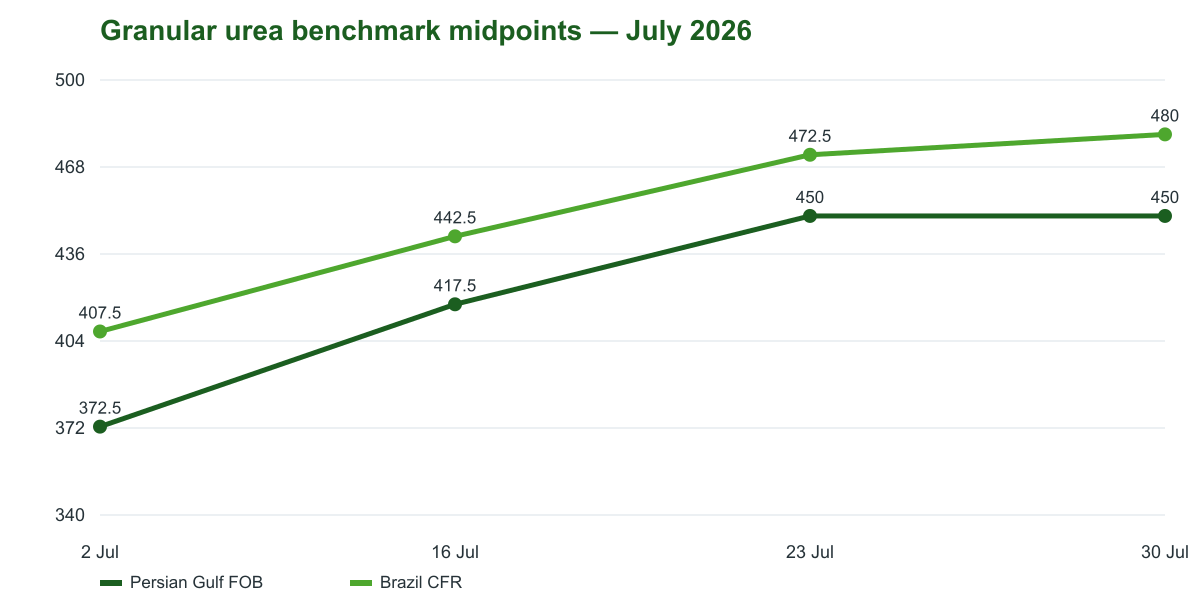
Figure 1. Granular urea benchmark midpoint trend
Source: supplied Argus Nitrogen issues dated 2, 16, 23 and 30 July 2026. Midpoints calculated from published ranges.
Regional reading
- Persian Gulf: stronger FOB values but unusually high execution and freight uncertainty.
- Brazil: CFR values advanced as seasonal import demand absorbed higher origin costs.
- China: FOB indications strengthened during the month, but policy and export availability remained decisive.
- Europe: production economics remained exposed to gas and carbon, sustaining import sensitivity.
Quality control: No unsupported NPK-style synthetic price series is inferred from urea. Each benchmark remains tied to its stated origin, product and delivery basis.
Urea supply and demand balance
The July rise in granular urea reflected a combination of active import demand and uncertainty over prompt export availability. India remained capable of changing the global balance through the timing and scale of tenders. Brazil provided seasonal support as importers positioned material for crop requirements. At the same time, Chinese export availability remained a central swing factor because even modest policy changes can alter the number of cargoes offered into Asia and Latin America.
Supply was not uniformly scarce at the production level. The tighter variable was the volume available at the right specification, loading window and freight cost. Persian Gulf cargoes carried greater execution risk, while Atlantic Basin material could command a different delivered value because of route security and voyage length. Buyers consequently evaluated origin diversity and shipping reliability alongside FOB price.
Other nitrogen products
Ammonium sulfate retained support from its combined nitrogen and sulfur value and from demand in regions where it remains an economical nutrient source. Chinese export economics and caprolactam-linked production were important, but values could not be summarized through a single global benchmark.
Ammonium nitrate, calcium ammonium nitrate and UAN remained more regional than urea: European gas costs, plant operating decisions, seasonal demand and regulation shaped nitrate economics. North American UAN was more closely tied to domestic application seasons and logistics. These products should therefore be compared on a like-for-like basis, considering their concentrations, nutrient bases, and delivery systems.
Nitrogen outlook: August–September
- Base case: urea remains supported but volatile as India, Brazil and China determine prompt balance.
- Bullish risk: renewed disruptions in the Persian Gulf, delayed vessel departures, or tighter Chinese export controls raise replacement costs.
- Bearish risk: slower tender activity, improved shipping and broader export availability trigger a correction.
- Commercial response: stagger purchases, retain alternative origins and avoid equating low FOB offers with low executable landed cost.
China, India and Brazil: the demand triangle
China is the principal supply-swing factor because its domestic production base is large and its export policy can alter the balance among prilled urea, granular urea, and nitrogen co-products. Export availability depends on domestic agricultural priorities, production economics, inspections, policy and port execution. Buyers should distinguish announced policy from cargoes that are actually licensed, offered and loaded.
India is the principal episodic buyer. Large tenders can absorb prompt cargoes from multiple origins and establish a reference for supplier netbacks. Tender timing, technical qualification, payment terms, shipment windows and awarded tonnage all matter. A headline tender volume is not equivalent to confirmed demand until awards and execution are visible.
Brazil offers broad seasonal demand and serves as a reference destination for granular urea. Importers balance soybean and maize requirements with credit, currency and port logistics. When Brazilian buyers are active at the same time as India, suppliers gain leverage; when one market pauses, cargoes can be redirected, and regional spreads adjust quickly.
European nitrates and UAN
AN and CAN are more closely tied to European production economics and regional regulation than seaborne urea. Their value reflects ammonia, nitric acid, natural gas, carbon, plant utilization and seasonal application. Product classification, safety rules and trade measures also constrain imports. As a result, nitrate prices can remain firm even if globally traded urea eases.
UAN is a liquid product with storage and transport requirements that limit long-distance arbitrage. North American values depend on domestic planting seasons, river logistics, terminal inventories, and nitrogen alternatives. European UAN is influenced by local production and trade policy. Concentration differences must be normalized before comparing nutrient cost.
For Green Gubre Group, the practical implication is to maintain separate market models for dry urea, ammonium sulfate, nitrates, and solutions. A generic nitrogen index cannot accurately represent the exposure of all products.
Ammonia Market
Ammonia weakened across the principal seaborne benchmarks during July. The Middle East FOB assessment fell by USD 120/metric ton from 2 July to 30 July, East Asia CFR by USD 90/metric ton and US Gulf CFR by USD 75/metric ton. Northwest Europe CFR eased early and then held at USD 700/metric ton.
| Date | Middle East FOB | East Asia CFR | NW Europe CFR | US Gulf CFR |
|---|---|---|---|---|
| 2 Jul | 680 | 755 | 725 | 710 |
| 16 Jul | 680 | 740 | 700 | 665 |
| 23 Jul | 610 | 675 | 700 | 665 |
| 30 Jul | 560 | 665 | 700 | 635 |
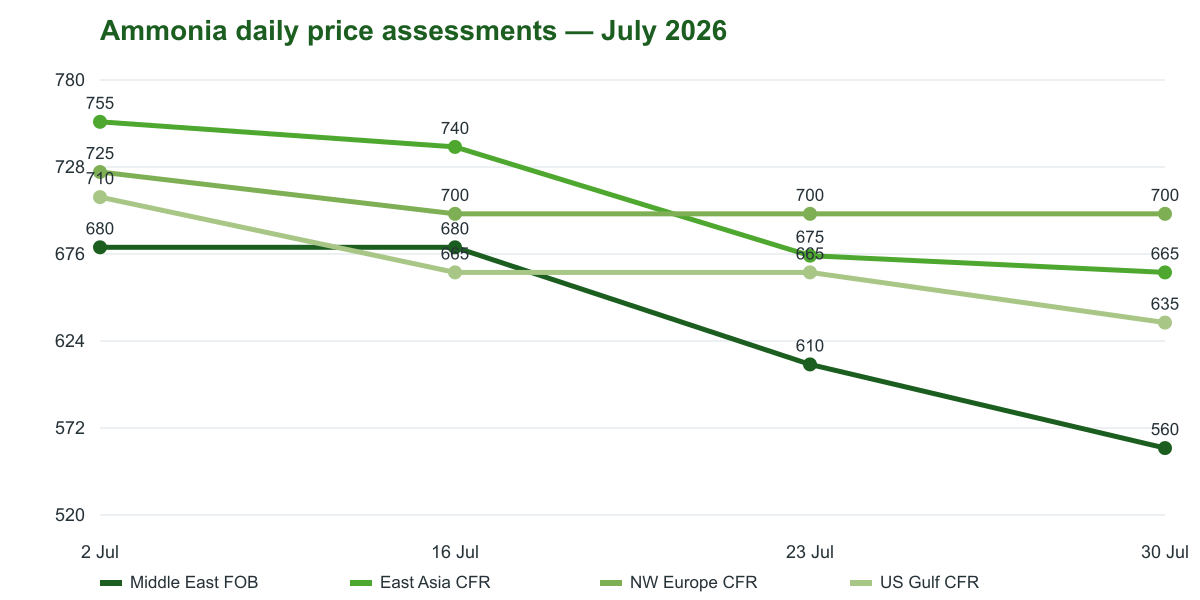
Figure 2. Ammonia daily price assessments
Source: supplied Argus Ammonia issues dated 2, 16, 23 and 30 July 2026.
The divergence between a stable Northwest Europe import assessment and falling values in the Middle East, East Asia, and the US Gulf underscores the importance of regional gas economics, replacement cost, and shipping constraints. Buyers should avoid extrapolating one region’s direction to another.
Regional ammonia dynamics
The decline in Middle East FOB and East Asia CFR values showed that supply and downstream demand were rebalancing despite the broader geopolitical risk premium. Ammonia is transported in specialized gas carriers, so its freight system differs from dry bulk fertilizers. Vessel availability, terminal compatibility, cargo size, and contractual scheduling can insulate one regional market from price changes elsewhere.
Northwest Europe remained comparatively firm because regional production costs influenced the economics of import replacement. A stable CFR assessment does not necessarily indicate strong final demand; it may instead reflect the cost of replacing marginal local output. In the US Gulf, lower CFR and FOB values reflected a softer balance, but domestic contract structures and industrial demand limited direct comparison with Asia.
Demand structure and production economics
Fertilizers account for a major share of global ammonia consumption, including urea, nitrates, phosphates, and compound products. Industrial uses—including chemicals, explosives and emerging energy applications—add further regional demand. Weakness in one downstream chain can create spot availability even when nameplate capacity has not changed.
Natural gas remains the dominant variable cost for conventional ammonia. However, plant reliability, carbon policy, feedstock curtailments and the cost of moving refrigerated cargoes determine the actual delivered cost curve. Buyers should monitor both production economics and the availability of suitable shipping capacity.
Ammonia outlook: August–September
- Base case: regional divergence persists, with a balanced-to-soft seaborne market and firmer high-cost import regions.
- Upside risk: major plant outages, gas curtailments or gas-carrier constraints tighten prompt availability.
- Downside risk: weak downstream operating rates and limited availability of Middle East or US Gulf cargoes could extend the decline.
- Commercial response: use regional benchmarks and contract formulas rather than a single global ammonia direction.
Ammonia trade routes and contract structures
Ammonia trade is concentrated around specialized terminals and refrigerated or semi-refrigerated gas carriers. A buyer cannot freely substitute among origins because port draft, storage temperature, unloading rate, vessel size, and product specifications must be compatible. Planned maintenance at a terminal or plant can therefore have an outsized regional effect.
Many ammonia transactions are conducted under term contracts or formulas rather than transparent spot deals. Monthly contract settlements, freight formulas and destination adjustments can coexist with spot assessments. When spot liquidity is limited, a benchmark may move in steps as new evidence emerges rather than continuously.
This market structure explains why July’s declines were uneven. East Asia reacted to weaker regional demand and available supply, the US Gulf reflected its own balance and Northwest Europe remained anchored by import replacement and production economics. Procurement policy should specify which benchmark and freight basis governs each contract.
Low-carbon ammonia: strategic but not yet the spot driver
Low-carbon and renewable ammonia projects are strategically important because ammonia can transport hydrogen and support decarbonization in the fertilizer, power, and shipping sectors. However, their economics, certification, carbon intensity, and offtake structures differ from those of conventional spot ammonia. Premium projects should not be priced by simply adding an arbitrary green premium to a conventional benchmark.
Carbon-border measures and customer emissions targets may increase the value of verified low-carbon supply in Europe and other markets. The commercial framework requires auditable production pathways, lifecycle emissions, guarantees of origin and clear allocation of transport emissions.
For this July report, conventional market assessments remain the primary reference. Low-carbon ammonia is treated as a medium-term strategic consideration rather than as a basis for unsupported monthly price estimates.
Sulphur Market
Sulfur remained one of the most consequential inputs in the fertilizer chain. The 9 July issue assessed Middle East FOB at USD 890–1,000/metric ton; the 30 July issue assessed it at USD 850–900/metric ton. The decline did not restore normal affordability: absolute values remained high enough to sustain pressure on the production costs of sulphuric acid and phosphate.
| Assessment | Low | High | Midpoint |
|---|---|---|---|
| 9 Jul Middle East FOB | 890 | 1,000 | 945 |
| 30 Jul Middle East FOB | 850 | 900 | 875 |
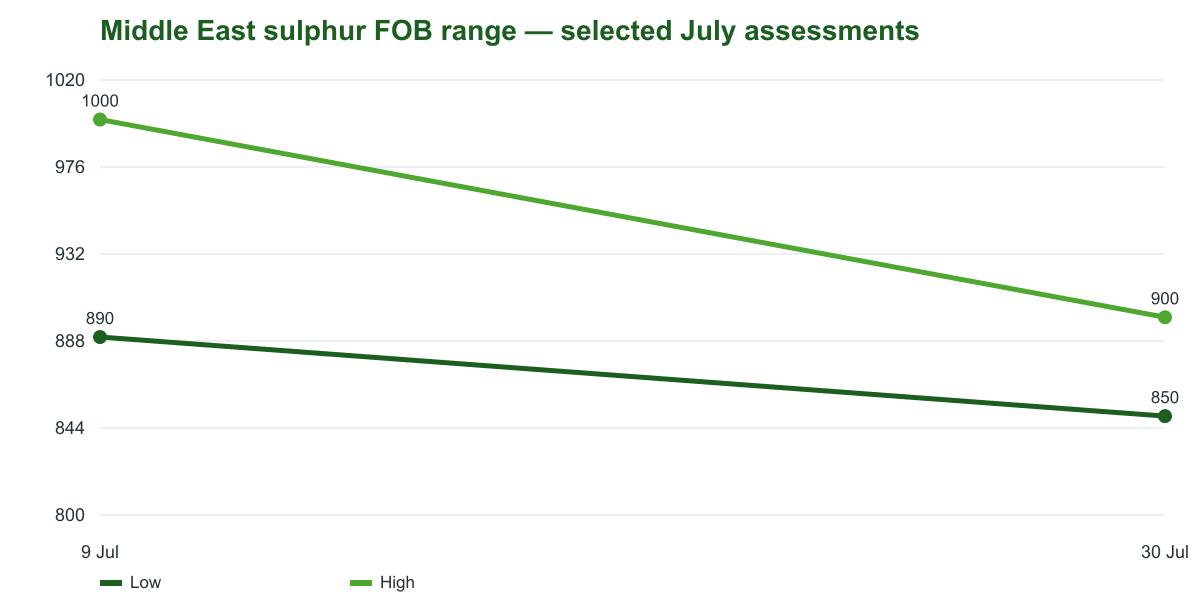
Figure 3. Selected Middle East sulfur FOB ranges
Source: supplied Argus Sulfur issues dated 9 and 30 July 2026.
Transmission effect: High sulfur values pass through sulphuric acid into phosphoric acid, DAP, MAP and phosphate-rich NPK grades. Procurement decisions should therefore monitor sulfur and freight alongside finished phosphate prices.
Supply structure
Most of the sulfur traded is recovered as a by-product of oil refining and natural gas processing. Supply, therefore, does not respond to fertilizer prices in the same way as a dedicated mine or fertilizer plant does. Refinery throughput, sour gas processing, maintenance, and hydrocarbon production determine how much elemental sulfur becomes available. This structural feature can slow the market's response when phosphate demand accelerates.
The Persian Gulf remains a critical export platform. Production may be physically available at terminals, yet vessel delays, war-risk premiums, and route restrictions can prevent timely delivery. Vancouver, the Black Sea, the Baltic, and the US Gulf provide alternative supply routes, but each route has its own parcel sizes, logistics, and destination economics.
Demand centers and downstream economics
China is the largest import market, and its port inventories, phosphoric acid operating rates, and domestic pricing influence seaborne sentiment. Morocco is strategically important because its integrated phosphate industry consumes large volumes of sulfur. India, Indonesia, and other Asian markets add demand from fertilizer and industrial users, while Brazil’s needs reflect its downstream phosphate and agricultural system.
At the July price level, the purchasing question shifted from whether sulfur was expensive to whether sufficient feedstock could be secured to maintain downstream production. A phosphate plant facing inadequate sulfur can lose more through reduced operating rates than it saves by delaying purchases. This asymmetry supports inventory coverage even when prices appear elevated.
Sulfur outlook: August–September
- Base case: values remain high but volatile as buyers balance supply security against affordability.
- Bullish risk: Persian Gulf shipping disruption or stronger Chinese and Moroccan demand tightens executable supply.
- Bearish risk: lower phosphate operating rates, improved vessel availability, or inventory liquidation reduces prompt pressure.
- Commercial response: manage physical coverage and freight capacity together; do not treat FOB price as the sole procurement variable.
Persian Gulf producer system
The Persian Gulf sulfur supply is linked to large sour-gas developments, refineries, and hydrocarbon processing. Qatar, the United Arab Emirates, Saudi Arabia, and Kuwait are significant exporters, while Iranian material can be traded on different terms due to sanctions, payment, and logistics challenges. Official monthly or quarterly producer prices may serve as references, but prompt cargo economics also reflect terminal availability and freight rates.
The physical product can be granular, formed, in lump form, or molten, depending on the origin and destination. Handling losses, dust, moisture, storage, and loading performance affect its commercial value. A nominally cheaper cargo may lead to higher operational costs if product quality or terminal performance is inferior.
During a maritime disruption, producers may accumulate inventory even while importing consumers face shortage. This apparent contradiction is a consequence of constrained shipping rather than insufficient production. It reinforces the report’s focus on executable supply.
China, Morocco and downstream operating rates
Chinese demand should be assessed using port inventories, domestic sulfur values, phosphate margins, and operating rates. High port stocks can reduce immediate imports, but strong phosphoric-acid production can draw inventories down quickly. Domestic refinery and smelter by-product supply also influences the import requirement.
Moroccan procurement is structurally important because the expansion of integrated phosphate production can require large, continuous sulfur inflows. Contract scheduling and vessel programs may reduce visible spot activity even when physical consumption is strong. Market participants should not interpret the absence of spot deals as an absence of demand.
Downstream operating rates form the principal demand lever. If DAP, MAP, or phosphoric acid margins deteriorate sufficiently to force curtailments, sulfur demand can weaken sharply. If producers prioritize volume or food-security contracts, they may continue buying despite poor spot economics.
Sulfur inventory policy
Sulfur inventory must be planned around plant consumption, storage capacity, fire and environmental controls, quality degradation and delivery variability. Excess inventory incurs financing and operational costs, but inadequate coverage can halt an entire phosphate chain. The risk is therefore asymmetric.
A useful policy separates minimum operational stock, strategic safety stock, confirmed transit inventory and optional future supply. Each category should have rules for ownership, quality, and expected availability. Cargoes waiting for vessel nomination should not be counted as available stock.
Trigger levels should respond to route risk, supplier concentration, and downstream margin. When Persian Gulf execution deteriorates, safety stock can be increased selectively; when logistics normalize and downstream rates fall, coverage can return toward normal.
Phosphates Market
The phosphate market retained a firm structural bias because elevated sulfur costs, constrained trade flows, and freight risk raised replacement values. The supplied sources did not provide a complete, comparable weekly series of July DAP/MAP; therefore, this report avoids publishing synthetic regional numbers.
| Driver | July assessment | Expected effect |
|---|---|---|
| Sulfur input cost | Exceptionally high | Raises sulphuric and phosphoric acid cost |
| Ammonia | Easing | Partial offset for DAP/MAP |
| Chinese export availability | Policy-sensitive | Limits transparent spot availability |
| Persian Gulf freight | Elevated and dispersed | Raises delivered replacement cost |
| Farm affordability | Under pressure | May delay discretionary demand |
Commercial interpretation
The net effect remained supportive, but the direction was not uniform. Easing ammonia provided some cost relief, whereas sulfur and freight remained dominant. Buyers should model DAP and MAP landed costs using separate input, conversion, and logistics assumptions rather than a single generalized market premium.
DAP, MAP and phosphoric acid
DAP and MAP share a common phosphate chain but serve different regional and agronomic markets. DAP demand is especially important in India and parts of Asia, while Brazil is a major destination for MAP. Product grade, nitrogen content, granulation, cadmium specifications, and destination rules can prevent simple price comparison even when both products are derived from phosphoric acid.
Phosphoric acid economics depend on phosphate rock, sulfur, ammonia, utilities, and plant integration. Higher sulfur costs can outweigh the benefit of weaker ammonia, particularly for producers purchasing feedstocks at market prices. Integrated producers with access to phosphate rock, conversion assets, and efficient ports retain an advantage, but they are not immune to sulfur and freight shocks.
Regional market structure
Morocco remained the most influential seaborne phosphate supplier because of its resource base and integrated production system. China remained a potential swing exporter, but domestic priorities and policy uncertainty limited transparency. Saudi Arabian supply was important to India and other Asian destinations, while US production served both domestic and export markets.
India and Brazil remained the key centers of import demand. Subsidies, retail pricing, importer inventories, and the timing of crop demand shape Indian procurement. Soybean and maize economics, credit, currency movements, and port logistics influence Brazilian purchases. A firm international market can therefore coexist with irregular buying as importers adjust timing rather than eliminate agronomic demand.
Phosphate outlook: August–September
- Base case: replacement values remain firm because high sulfur offsets softer ammonia.
- Bullish risk: constrained Chinese exports, strong Indian procurement, or higher sulfur and freight.
- Bearish risk: affordability destroys prompt demand, inventories rise, or sulfur corrects materially.
- Commercial response: track raw-material parity and destination-specific demand rather than relying on unverified generic price curves.
Phosphate rock and producer integration
Phosphate rock quality varies by grade, beneficiation requirement, cadmium and other impurities. Rock cannot be compared solely by USD per metric ton because P2O5 content, recovery, transport and processing behavior affect usable value. Integrated producers can optimize rock, acid and finished fertilizer across the chain, while non-integrated plants purchase more of these risks from the market.
Morocco’s resource base and integrated assets create a central role in global supply. China's large production and consumption make export policy decisive. Saudi Arabia and Jordan benefit from resource and geographic positions, while US production serves a substantial domestic agricultural system. New capacity can change trade flows, but commissioning and ramp-up are rarely immediate.
For buyers, producer integration can improve reliability but increase concentration risk. Supplier qualification should include mine and plant reliability, sulfur sourcing, port capability, and destination experience.
India and subsidy economics
The nutrient-based subsidy system shapes Indian phosphate demand, maximum retail prices, the rupee exchange rate, importers' working capital, and monsoon-dependent crop requirements. When international replacement cost rises faster than subsidy support, importer economics weaken even if agronomic demand is strong.
Procurement can therefore occur in irregular waves. Buyers may delay purchases while seeking policy adjustment or lower offers, then return when inventories approach minimum levels. Producers monitor not only tender activity but also port stocks, domestic production and the relative economics of DAP, NPK and alternative phosphate sources.
A strong CFR assessment should not be interpreted as unlimited buyer acceptance. Affordability can eventually reduce application, increase subsidy cost, or shift demand toward other formulations.
Brazil and MAP purchasing
Brazil is highly import-dependent for fertilizers and is the major global destination for MAP. Demand follows planting calendars, but purchasing decisions are distributed among importers, blenders, and large agricultural groups. Credit availability, barter ratios, the Brazilian real, and soybean or maize prices influence the timing of commitments.
Port capacity and inland logistics are essential to delivered value. Product arriving after the optimal blending or application window can lose commercial value even if its benchmark price was attractive. Buyers therefore weigh shipment reliability against FOB savings.
MAP also competes with other phosphate sources and blends. Exact nutrient content, granulation and agronomic program should be incorporated into comparisons rather than relying on a single CFR number.
Potash Market
Potash was comparatively stable. Nutrien reported global shipments of approximately 74.5 million metric tons in 2025 and forecast 74–77 million metric tons for 2026. It also maintained manufactured potash sales guidance of 14.1–14.8 million metric tons. Mosaic expected approximately 9 million metric tons of potash production in 2026; first-quarter sales and production were each about 2.2 million metric tons.
| Indicator | Volume (million metric tons) | Status |
|---|---|---|
| 2025 global potash shipments | 74.5 | Reported |
| 2026 global shipment range | 74–77 | Forecast |
| Nutrien 2026 sales guidance | 14.1–14.8 | Guidance |
| Mosaic 2026 production | ~9.0 | Expectation |
| Mosaic Q1 2026 sales | 2.2 | Reported |
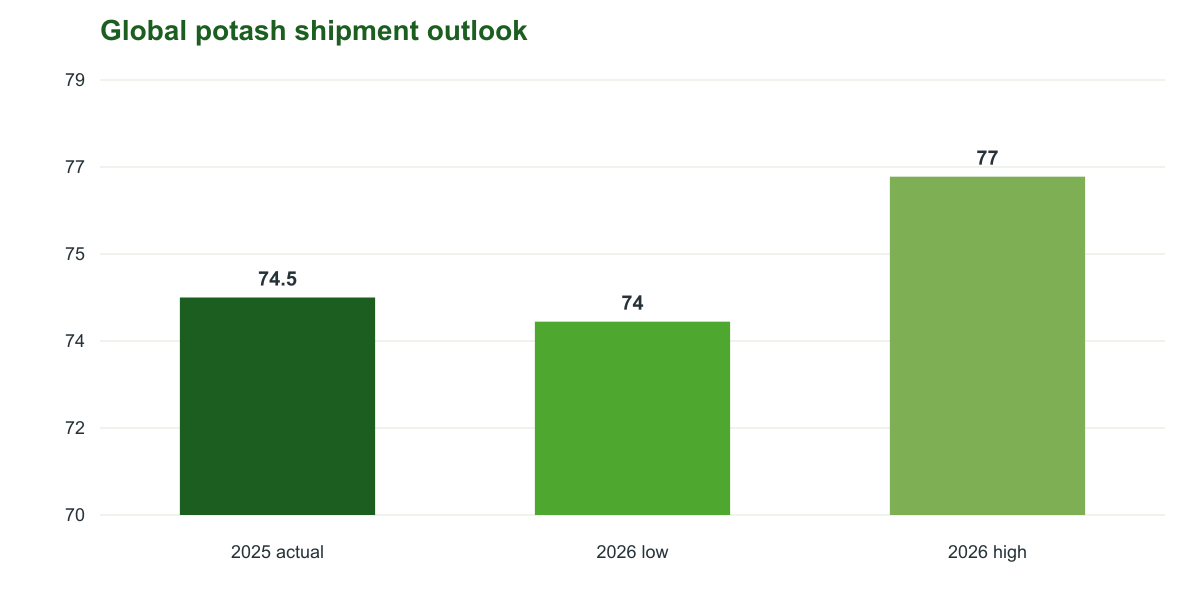
Figure 4. Global potash shipment outlook
Source: Nutrien full-year 2025 results and 2026 guidance.
Data limitation: No licensed July potash weekly report was supplied. Exact Vancouver FOB, Brazil CFR, Southeast Asia CFR and SOP spot curves are intentionally omitted.
Supply concentration and trade flows
Potash supply is concentrated in Canada, Russia, Belarus, China, Israel, Jordan, and a smaller group of European and Asian producers. New mine capacity requires long lead times and substantial capital, while existing producers can influence the market through operating discipline. Canadian exports remain central to seaborne supply; Russian and Belarusian volumes continue to reach international markets, but may entail additional complexities in banking, insurance, documentation, and sanctions compliance.
The recovery of alternative trade routes reduces the probability of a severe global shortage, but it does not remove regional premiums. A cargo available by rail into China has different economics from that of material delivered to Brazil, Southeast Asia, or an inland North American market. Logistics concentration—railways, dedicated terminals and long ocean routes—remains a structural vulnerability.
Demand centers and agronomic resilience
Potassium supports water regulation, root development, nutrient transport, stress tolerance and crop quality. Farmers can temporarily draw down soil reserves, making short-term demand more discretionary than nitrogen, but sustained under-application reduces soil fertility and eventually constrains yield. This creates a recurring replenishment cycle after large harvests.
Brazil, China, India, Southeast Asia and North America remain the major demand centers. Brazil’s import dependence and large soybean and maize areas make it strategically important, though credit and exchange rates influence timing. Plantation crops support Southeast Asian demand. China and India rely on contract and inventory management, whereas North American consumption is closely tied to application windows and dealer stock.
MOP, SOP and affordability
Muriate of potash is the dominant product for broad-acre crops. Sulfate of potash serves chloride-sensitive and higher-value crops and normally commands a premium because of its smaller production base and specialty demand. The two products should not be treated as interchangeable benchmarks.
Potash retained a relative affordability advantage because MOP does not require natural gas, ammonia, or sulfur as major feedstocks. Nevertheless, farmer economics are evaluated in local currency and against crop revenue. High interest rates, weak commodity prices, or currency depreciation can delay applications even when potash is inexpensive relative to nitrogen and phosphate.
Potash outlook: August–September
- Base case: stable-to-firm conditions, with adequate supply preventing acute shortage.
- Bullish risk: stronger Brazilian or Southeast Asian demand, Canadian logistics constraints or renewed sanctions disruption.
- Bearish risk: delayed grower buying, weaker crop prices or rising Russian and Belarusian availability.
- Commercial response: maintain normal coverage and use licensed spot benchmarks for price-sensitive negotiations.
Canada and Canpotex logistics
Canadian potash moves from Saskatchewan mines through a highly integrated rail and terminal system. Offshore marketing requires dependable railcars, storage, and Pacific or Atlantic port capacity. Strong producer sales commitments can tighten prompt availability even when mine production is adequate.
Canpotex provides scale and destination reach, but the concentration of export infrastructure creates exposure to rail disruptions, labor issues, weather, wildfire, and terminal performance. Buyers should monitor producer guidance together with logistics indicators.
Nutrien and Mosaic guidance indicates substantial annual capacity, but annual figures do not guarantee a specific weekly cargo window. Contract commitments, maintenance and destination allocation determine prompt supply.
Russia, Belarus and sanctions complexity
Russian and Belarusian potash remains important to global balance. Alternative ports, rail routes and destination markets have allowed volumes to continue, limiting the risk of an absolute global shortage. However, the commercial chain may require enhanced due diligence regarding banks, insurers, vessels, owners, documentation, and applicable sanctions.
Discounted FOB offers should be evaluated against payment risk, delay probability, and resale limitations. A cargo that cannot be financed or insured by the buyer’s counterparties is not equivalent to unrestricted supply.
Qualified legal and sanctions professionals must make compliance decisions. Market analysis can identify exposure but cannot replace transaction-specific legal review.
Contract benchmarks and spot transparency
China and India often use major contract negotiations to establish reference points for Asian potash trade. Contract prices may cover large volumes and extended periods, while spot transactions reflect prompt regional balance. The two should not be combined without acknowledging the difference in timing and terms.
Producer netbacks also vary by freight and product grade. Standard MOP, granular MOP, and SOP serve different markets. A published contract number can guide sentiment, but it does not create a complete weekly curve for Vancouver FOB, Brazil CFR, or Southeast Asia CFR.
The final report therefore preserves the verified shipment and producer outlook while directing price-critical users to licensed Argus, CRU, ICIS or S&P Global data.
NPK and Compound Fertilizers
Compound fertilizers combine the economics of nitrogen, phosphate, and potash inputs. Earlier draft values for individual NPK grades could not be reconciled to a supplied benchmark series and have been removed. The verified July input picture supports a directional, not numerical, assessment.
| Cost component | July direction | NPK implication |
|---|---|---|
| Nitrogen/urea | Higher | Raises nitrogen contribution |
| Phosphate inputs | Firm | Raises phosphorus contribution |
| Potash | Stable to firm | Relatively neutral |
| Sulphur | High | Raises phosphate-rich formulations |
| Freight/insurance | Elevated | Widens delivered regional spreads |
Recommended buying approach: compare formulations on delivered nutrient cost, use staggered coverage, and verify whether quoted grades are chemically equivalent before making cross-market comparisons.
Formulation economics
An NPK grade is not a single commodity. The cost of a 15-15-15, 20-20-0, or crop-specific formulation depends on nutrient concentration, raw material selection, granulation route, fillers, additives, packaging, and plant scale. Two products with the same headline grade can have different physical quality, nutrient solubility, trace-element content, and delivered performance.
During July, higher urea and firm phosphate inputs increased replacement costs for many formulations, while stable potash provided only partial relief. Producers using ammonium sulfate or potash sulfate also remained exposed to sulfur-related economic risks. Freight and packaging mattered more for smaller parcels and bagged products than for large bulk cargoes.
Regional demand and procurement
Southeast Asian plantation agriculture, African nutrient programs, Brazilian crop demand, and subsidized Asian markets support compound fertilizer consumption. European producers face higher energy, labor, and regulatory costs, while Chinese and other Asian manufacturers may benefit from economies of scale but remain exposed to export policies and freight costs.
Buyers should calculate cost per unit of available nutrient rather than compare only USD per metric ton. They should also evaluate nutrient balance for the target crop and soil. A lower-priced grade can be more expensive if it supplies unwanted nutrients or requires additional application and logistics.
NPK outlook and risk controls
- Use raw-material escalation clauses only when the underlying indices and formulas are transparent.
- Verify grade, nutrient solubility, granule strength, moisture content, packaging, and tolerance before comparing offers.
- Stagger purchases where raw materials are volatile, while securing critical seasonal volumes early enough to protect delivery.
- Do not publish synthetic market prices without a verified benchmark series for the exact grade and basis.
Production routes and quality variables
Compound fertilizers can be produced through chemical granulation, steam granulation, bulk blending or other processes. Chemical granulation can improve nutrient distribution within each granule, while bulk blends rely on compatible particle size and density to reduce segregation. The correct choice depends on crop, distribution system, application equipment and price.
Quality specifications should address total and available nutrients, moisture, particle-size distribution, crushing strength, caking, dust, chloride, micronutrients and packaging. Storage climate and voyage duration can materially affect conditions on arrival. A low headline price does not compensate for segregation, caking or nutrient non-conformance.
Inspection should be designed around risk. Pre-shipment certificates, independent sampling, loading supervision and discharge claims procedures are particularly important for new suppliers or long voyages.
Blender margin and working capital
NPK producers and blenders handle multiple raw materials whose prices do not move in tandem. A rise in urea can reduce the margin on fixed-price finished-product sales, while a fall in ammonia may provide relief only if the formulation uses ammonia directly. Inventory accounting and contract escalation determine when changes in raw materials appear in commercial results.
The number of raw materials also increases working-capital requirements. Procurement must balance minimum economic parcel size against storage, financing, and formulation flexibility. Excess stock of one nutrient can force a blender to produce suboptimal grades or delay purchases of another nutrient.
A formulation margin model should therefore track nutrient cost, conversion, packaging, loss, finance, freight, and sales price by grade. Generic percentage assumptions are insufficient for final commercial decisions.
Methanol and Petrochemical Feedstocks
Methanex’s July posted prices illustrated exceptional regional dispersion: USD 1,480/metric ton in North America, USD 620/metric ton in Asia Pacific, and USD 525/metric ton in China. The European third-quarter posted contract price was EUR 915/metric ton and is not converted here because the report avoids introducing an unverified FX rate into a USD-only comparison.
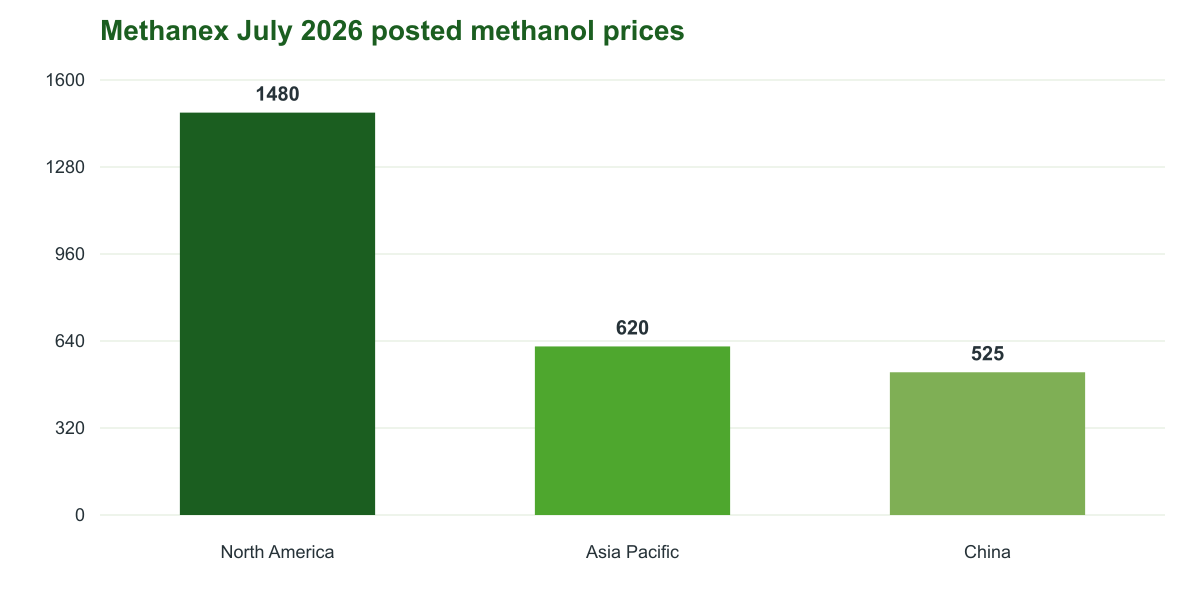
Figure 5. Methanex July 2026 posted methanol prices
Source: Methanex official regional pricing page. Posted prices are not spot assessments and may not represent realized transaction prices.
| Region | Posted price | Basis/validity |
|---|---|---|
| North America | USD 1,480/metric ton | 1–31 Jul 2026; non-discounted reference |
| Asia Pacific | USD 620/metric ton | 1–31 Jul 2026 |
| China | USD 525/metric ton | 1–31 Jul 2026 |
| Europe | EUR 915/metric ton | 1 Jul–30 Sep 2026; excluded from USD chart |
Interpreting posted methanol prices
Posted contract prices are reference values rather than a direct record of every transaction. Discounts, formulas, freight, contract duration, customer relationships and regional market conventions can create a substantial difference between a posted value and a realized netback. The North American posted price should therefore not be read as evidence that every buyer paid USD 1,480/metric ton.
The wide regional spread reflects different pricing systems as well as supply-demand conditions. China has a large domestic coal-based methanol industry and a liquid spot market. Asia Pacific imports reflect regional contracts and ocean freight. North America combines domestic production, imports and contract structures. Europe’s quarterly euro-denominated reference introduces both a different validity period and foreign-exchange exposure.
Feedstocks and downstream demand
Methanol production is based primarily on natural gas or coal, resulting in very different carbon intensities and cost structures. Gas availability, coal policy, plant outages and freight from major export hubs influence regional competitiveness. Persian Gulf logistics are relevant because the region supplies methanol alongside ammonia, urea and other petrochemicals.
Downstream demand includes formaldehyde, acetic acid, MTBE, fuel applications, solvents and methanol-to-olefins. Changes in construction, automotive activity, gasoline blending and Chinese olefins economics can therefore affect methanol independently of fertilizer demand. The product is included in this report as a feedstock and energy-linked comparator rather than as a fertilizer.
Near-term methanol watchpoints
- Persian Gulf export execution and vessel insurance.
- Chinese coal economics and methanol-to-olefins operating rates.
- Natural-gas availability and outages at major export plants.
- Contract discounts and realized prices relative to published postings.
- Currency conversion for European contracts; no USD comparison should be made without an explicit dated FX rate.
Regional production economics
Gas-based producers in the Persian Gulf, North America, Trinidad and other export regions compete with coal-based Chinese capacity and a range of regional plants. Feedstock contracts, plant scale and integration create substantial cost differences. A high posted price can coexist with lower realized transaction volumes when producers offer discounts to maintain customer relationships and operating rates.
China’s domestic market is particularly important because coal prices, environmental restrictions and methanol-to-olefins margins influence both production and import demand. Coastal import parity can diverge from inland coal-based economics. Asia Pacific buyers therefore monitor Chinese port stocks and derivatives alongside contract postings.
Plant outages can have a rapid effect because methanol trade is concentrated among major producers and terminals. The impact depends on inventory, destination flexibility and whether another supplier can provide compatible delivery timing.
Methanol commercial risk
Methanol is flammable and toxic, requiring appropriate tankage, handling, documentation and regulatory compliance. Terminal constraints limit the ability to substitute dry bulk freight or storage. Long-term contracts can improve security but may include price formulas that differ from those in the spot market.
Currency is another source of risk. European references are denominated in euros, while many feedstocks, freight contracts and global comparisons use USD. Converting a quarterly price with an undated exchange rate can create a misleading chart, so this report leaves the European value in its published currency.
For internal reporting, posted price, estimated discount, freight, duty, storage and financing should be shown separately. This creates a traceable bridge from public reference to expected landed or realized value.
Freight and Logistics
Shipping risk became a price-forming variable. IMO reported on 8 July that hundreds of vessels and around 6,000 seafarers remained stranded in the Persian Gulf. The operational question was not merely whether product existed, but whether a cargo could transit safely, obtain insurance and arrive within the required commercial window.
| Corridor/factor | July condition | Commercial consequence |
|---|---|---|
| Strait of Hormuz | Volatile and security-constrained | Irregular Persian Gulf departures |
| Red Sea / Gulf of Aden | Heightened piracy and attack risk | Rerouting and insurance premiums |
| Black Sea | Operational but exposed | Compliance and voyage-interruption risk |
| Marine insurance | Elevated | Higher landed cost |
| Vessel availability | Origin-specific | Wide freight dispersion |
Landed-cost discipline
- Quote commodity, freight, war-risk insurance, financing, and demurrage separately.
- Use executable sailing windows rather than nominal loading dates.
- Maintain alternative origins and routing options.
- Preserve the term “Persian Gulf” consistently in commercial and analytical documentation.
Strait of Hormuz and Persian Gulf execution
The Strait of Hormuz affects exports of urea, ammonia, sulfur, methanol, LPG, LNG, crude oil and petrochemicals. July conditions did not mean that every transit stopped permanently. Instead, shipowners, flag states, insurers and charterers evaluated voyages individually. This produced irregular departures, waiting time and a wider range of freight indications.
The commercial distinction between nominal and executable availability is crucial. Product can be manufactured, stored, and even nominated for loading while remaining unavailable to a buyer if a suitable vessel cannot safely enter or depart. Procurement teams should therefore request evidence of vessel nomination, insurance acceptance and realistic laycan timing before treating an offer as equivalent to a cargo from a lower-risk route.
Red Sea, Black Sea and alternative routing
Insecurity in the Red Sea and the Gulf of Aden can affect trade among Asia, the Middle East and Europe. Diversion around the Cape of Good Hope reduces exposure to the high-risk corridor but increases sailing distance, bunker consumption, voyage time and vessel employment. The economic impact differs by ship class and destination.
Black Sea trade remained exposed to physical security, sanctions, banking, and documentation risks. Cargoes can retain an apparent freight advantage into the Mediterranean or Latin America while carrying higher execution complexity. Buyers should compare all-in delivered cost and contractual remedies, not only the quoted freight rate.
Freight contracting priorities
- Define who bears war-risk premium changes and route-deviation costs.
- Clarify demurrage, waiting time, force majeure and safe-port obligations.
- Match parcel size and vessel class to the terminal's capabilities and the expected route.
- Verify sanctions, ownership, flagging, insurer, and the acceptability of the payment chain before nomination.
- Maintain an alternative logistics plan for critical seasonal cargoes.
Vessel classes and product compatibility
Urea, sulfur, phosphates, potash and NPK generally move in dry-bulk vessels, but parcel size, stowage, contamination sensitivity and terminal equipment differ. Gas carriers transport ammonia, while chemical tankers transport methanol. Freight comparisons must therefore remain within compatible vessel and cargo systems.
Larger vessels can lower unit cost but require sufficient cargo volume, port draft, storage and discharge capacity. Smaller parcels offer flexibility but may carry a higher USD-per-metric-ton rate. Split cargoes can optimize logistics but add complexity in nomination, quality and laytime.
Cargo readiness and port performance are as important as sailing distance. A low freight fixture can be offset by waiting time, demurrage, slow discharge or insufficient storage at destination.
Insurance, finance and documentation
War-risk insurance can change rapidly by route, vessel ownership and incident. Charter parties should specify how additional premiums are calculated and allocated. Cargo insurance, protection and indemnity cover and vessel hull insurance serve different purposes and should not be conflated.
Banks may apply restrictions beyond the minimum legal sanctions framework. A technically legal cargo can still face payment delay if a bank, insurer or correspondent declines the transaction. Early screening of all parties reduces the risk of a vessel arriving while documents or funds remain blocked.
Bills of lading, certificates of origin, quality documents, sanctions declarations and inspection certificates should be aligned before loading. Documentary inconsistency is a preventable source of delay and commercial dispute.
Freight monitoring dashboard
- Indicative freight by route, parcel size and vessel class.
- War-risk premium and insurer availability.
- Vessel nominations, arrival dates and actual departures.
- Port congestion, berth performance and demurrage exposure.
- Bunker prices and route-deviation assumptions.
- Sanctions and banking acceptability of the transaction chain.
Regional Market Synthesis
| Region | Position | Main July driver | Near-term watchpoint |
|---|---|---|---|
| North America | Cost-advantaged nitrogen; high methanol post | Low-cost gas and integrated logistics | Heat-driven gas demand |
| Europe | Import-sensitive | Gas, carbon and freight | Energy and import replacement cost |
| Persian Gulf | Low-cost production; execution risk | Strait of Hormuz security | Vessel departures and insurance |
| China | Policy-sensitive exporter / major consumer | Export availability | Policy and domestic demand |
| Brazil | Major import demand center | Seasonal fertilizer buying | Credit, FX and freight |
| India | Large tender/contract buyer | Procurement timing | Tender volumes and monsoon |
| Southeast Asia | Constructive nutrient demand | Plantation agriculture | Currency and palm-oil economics |
Regional spreads should be interpreted as different commercial systems rather than interchangeable price points. Origin, product specification, parcel size, Incoterms, timing, sanctions exposure, and route security can materially affect the delivered result.
America
North America maintained a strong cost position in nitrogen because of domestic gas supply, integrated infrastructure and access to the US Gulf. Seasonal application patterns, inland transport and river logistics can nevertheless create large local differences. Brazil remained one of the most important import markets across urea, MAP and potash; its demand was structurally supported by planted area but commercially constrained by credit, currency and farmer margins.
Latin American buyers often compare cargoes from the Persian Gulf, North Africa, Nigeria, the Baltic, the Black Sea, China and North America. The optimal origin varies with the product, timing, and freight. A globally firm market can still produce temporary destination weakness if buyers are well covered or financing limits procurement.
Europe, Asia and the Persian Gulf
Europe remained the region most visibly exposed to the interaction among gas, carbon, and import-replacement costs. High-cost domestic production increases reliance on external supply, but maritime disruption can raise the cost of that alternative. This tension supports regional prices even when seaborne benchmarks soften elsewhere.
China and India remained swing markets. Chinese export policy can affect global fertilizer availability, while Indian tenders can absorb large volumes within a short period. Southeast Asian demand is diverse, combining rice, plantations and specialty crops. The Persian Gulf retained strong production economics but carried the month’s greatest uncertainty in logistics and security.
Africa and food-security considerations
North Africa is both a major production platform and a significant agricultural market. Gas-based nitrogen and integrated Moroccan phosphate capacity provide strategic export positions. Sub-Saharan African demand has long-term growth potential, but affordability, credit, port capacity, bagging and inland distribution constrain the pace of consumption.
In markets with limited working capital, higher freight and financing costs can reduce nutrient application even when physical product is available. Commercial strategies should therefore consider smaller parceling, inventory finance and distributor reliability in addition to benchmark price.
Regional comparison: what changes the landed result
The same FOB cargo can yield different delivered values due to ocean distance, parcel size, insurance, duty, port costs, inland transport, financing, and discharge performance. For this reason, regional premiums should not be interpreted as pure demand strength. A high CFR market may simply reflect a difficult route or inefficient logistics.
Tax and subsidy regimes also change purchasing behavior. India’s subsidy framework, Brazil’s credit and barter system, European carbon policy and North American seasonal logistics create different responses to the same global benchmark. Regional analysis must combine policy and physical flows.
A consistent internal template should record product specification, origin, destination, incoterm, loading window, parcel size, payment, freight, insurance and source date. Without these fields, cross-region comparisons can be misleading.
Country watchlist for August and September
- India: urea tenders, DAP import economics, subsidy decisions and monsoon progress.
- China: nitrogen and phosphate export availability, sulfur port inventories and domestic production.
- Brazil: import pace, grower credit, BRL movement, soybean/maize economics and port arrivals.
- United States: natural-gas prices, crop conditions, river logistics and seasonal nitrogen demand.
- Morocco: phosphate operating rates, sulfur buying and export programs.
- Persian Gulf exporters: plant operations, terminal inventories, vessel departures and route security.
- Canada: potash production, rail performance and offshore sales commitments.
Scenario Outlook
The outlook is framed qualitatively because the numerical probability weights in the earlier draft were internal estimates and lacked an approved forecasting methodology.
| Scenario | Conditions | Expected market response | Management posture |
|---|---|---|---|
| Base case | Volatile but functional corridors; steady demand | Urea and phosphates supported; ammonia balanced; potash stable | Stagger coverage and preserve optionality |
| Bull case | Renewed Persian Gulf / Red Sea disruption | Freight, sulfur and delivered nitrogen strengthen | Raise safety stocks for critical products |
| Bear case | De-escalation; improved vessel flow; softer demand | Freight and risk premiums ease; ammonia/urea soften | Avoid over-covering at peak replacement cost |
Leading indicators
- Strait of Hormuz vessel departures and security advisories
- India urea tender timing and awarded volumes
- Chinese fertilizer export policy
- Brazil import pace and grower credit
- Middle East sulfur availability and freight
- Henry Hub and European gas benchmarks
Base-case narrative
The base case assumes that major corridors remain functional but unreliable. In this environment, urea retains support from periodic large tenders and seasonal demand; ammonia remains regionally mixed; sulfur remains expensive enough to support phosphate replacement costs; and potash remains the least volatile major nutrient. Freight premiums fluctuate with individual incidents rather than normalize immediately.
This environment rewards staggered procurement. Buyers that wait for a perfect price risk missing workable vessels or seasonal delivery windows; buyers that cover everything at once risk locking in elevated risk premiums. A portfolio of origins, contracts and delivery dates provides the most balanced response.
Stress and relief cases
In the stress case, renewed attacks or restrictions in the Persian Gulf or Red Sea reduce executable exports. Sulfur and nitrogen respond quickly because the affected region is important to both markets, whereas phosphate values rise due to input and freight costs. Working-capital requirements increase as transit times lengthen and buyers carry more safety stock.
In the relief case, de-escalation improves vessel availability and reduces insurance premiums. Additional prompt cargoes become executable, freight ranges narrow, and buyers resist high replacement offers. Urea and ammonia are most exposed to a correction; sulfur may soften if downstream users are covered, while potash remains guided by broader agricultural demand and producer discipline.
Scenario governance
- Do not assign numerical probabilities unless management approves a repeatable forecasting method.
- Define observable triggers for moving between scenarios.
- Link inventory, procurement and credit actions to those triggers.
- Review scenarios weekly during acute corridor disruption and monthly under normal conditions.
Product behavior by scenario
Urea is expected to react quickly to India tenders, Chinese availability, and execution in the Persian Gulf. Ammonia may respond differently because specialized shipping and downstream demand can dominate the response. Sulfur is highly sensitive to Persian Gulf freight and phosphate operating rates. Phosphates transmit sulfur cost but can also face affordability limits. Potash is likely to remain the most stable unless logistics or sanctions change materially.
NPK does not have a single scenario response because formulation cost depends on the nutrient mix. Nitrogen-rich grades are more exposed to urea, phosphate-rich grades to sulfur and DAP/MAP, and balanced grades to all three nutrients. Methanol follows its own feedstock and downstream chain but shares Persian Gulf logistics and energy risk.
The correct management response is therefore product-specific. A single instruction to increase or reduce all inventory would ignore differences in supply concentration, lead time, price volatility and operational criticality.
Trigger matrix
A move toward the stress case should be considered when confirmed vessel departures fall, insurers withdraw capacity, freight ranges widen sharply, India awards large prompt volumes, Chinese exports tighten or sulfur cargo availability deteriorates. One indicator alone may be noisy; a cluster of signals provides stronger evidence.
A move toward the relief case should be considered when security advisories improve, stranded vessels depart, war-risk premiums fall, prompt cargo offers broaden, and destination buyers become covered. Lower benchmark values without better physical execution may not represent genuine relief.
Scenario decisions should record the evidence, action, owner, and review date. This creates a disciplined audit trail and avoids repeated decisions based on market rumor.
Financial effects of the scenarios
The stress case raises not only commodity and freight costs but also cash tied in inventory and transit. Longer voyages, additional safety stock, and higher insurance can increase working capital before sales prices adjust. Credit exposure may grow as customers request longer payment terms to manage their own affordability.
The relief case can result in inventory losses if high-cost stock is held while replacement values decline. Buyers should therefore combine physical security with measured coverage rather than maximizing inventory. Contracts with transparent indexation or back-to-back sales can reduce mismatch.
Finance teams should run liquidity and margin sensitivity using product-specific price, freight, FX and delay assumptions. Scenario analysis becomes useful only when it changes credit, procurement or inventory decisions.
Strategic Conclusions and Recommendations
Central conclusion: Logistics, financing and security now determine the difference between nominal and executable supply. Risk management is therefore a source of commercial advantage, not a support function.
| Priority | 0–30 days | 30–90 days | 90+ days |
|---|---|---|---|
| Procurement | Map supplier/origin exposure | Add qualified alternatives | Build portfolio-based sourcing |
| Inventory | Review safety stock for sulphur/phosphates | Set scenario triggers | Formalize resilience targets |
| Freight | Separate freight and insurance | Pre-negotiate route options | Develop multi-corridor playbook |
| Finance | Review counterparty and FX exposure | Expand financing flexibility | Integrate landed-cost risk limits |
| Intelligence | Daily corridor monitoring | Benchmark data governance | Create executive dashboard |
Product-specific guidance
| Product | Recommended posture |
|---|---|
| Urea | Diversify origins and stagger purchases; monitor India and China. |
| Ammonia | Maintain regional diversification; avoid assuming uniform global direction. |
| Sulphur | Increase visibility and coverage where phosphate production depends on prompt supply. |
| DAP / MAP | Model sulfur, ammonia and freight separately. |
| Potash | Maintain normal coverage; obtain licensed spot benchmarks for price-critical decisions. |
| NPK | Buy on verified nutrient and delivered-cost equivalence, not generic grade labels. |
| Methanol | Distinguish posted reference prices from realized and spot prices. |
Procurement architecture
Supplier diversification should be measured by true risk factors rather than supplier count alone. Two suppliers loading from the same terminal, using the same route, or relying on the same banking channel may not provide meaningful diversification. The portfolio should be mapped across country, plant, port, route, vessel class, insurer, currency, and payment mechanism.
Contracts should preserve flexibility without transferring unmanageable uncertainty to either party. Quantity tolerance, delivery windows, substitution rights, escalation formulas, and force majeure provisions should be aligned with product criticality. Spot buying remains useful for price discovery, but strategic products require a reliable base of term coverage.
Inventory and financial management
Safety stock should reflect lead-time variability and the cost of disruption, not a fixed number of days for every product. Sulfur or a critical phosphate feedstock may justify higher coverage when a plant shutdown would be costly. Potash may require normal coverage where supply is balanced. Transit inventory must be monitored separately because a cargo delayed offshore is not equivalent to available warehouse stock.
Financial planning should integrate commodity prices, freight, insurance, foreign exchange, interest, and counterparty exposures. Higher prices and longer voyages increase working capital requirements simultaneously. Credit lines and hedging authority should be reviewed before a disruption, not after liquidity becomes constrained.
Market-intelligence operating model
A practical executive dashboard should combine benchmark prices with physical indicators: plant outages, tenders, vessel departures, port inventories, freight, insurance, and crop economics. Data ownership and definitions should be documented so that commercial, finance, and operations teams make decisions based on the same assumptions.
Management should distinguish facts, market reports, and internal judgments. Facts include published assessments and confirm corporate guidance. Market reports summarize observed trade and sentiment. Internal judgments include scenario direction and recommended coverage. Labeling these categories increases accountability and prevents a directional view from being mistaken for a verified transaction.
Executive action checklist
- Approve product-specific minimum and maximum coverage bands.
- Review concentration by origin, corridor, and counterparty.
- Pre-approve alternative ports, vessels, insurers, and payment channels.
- Establish weekly trigger reviews for Persian Gulf, Red Sea, India, and Chinese export tenders.
- Require landed-cost decomposition for major purchases.
- Retain licensed benchmark access for negotiations where exact spot values are commercially material.
Governance and decision rights
Market volatility requires clear authority. Procurement should know who can approve origin changes, additional insurance, higher safety stock and alternative payment structures. Operations should define minimum feedstock coverage and acceptable product substitutions. Finance should set liquidity, FX and counterparty limits. Legal and compliance should retain authority over sanctions and contractual risk.
A cross-functional market committee can review the dashboard and triggers on a fixed schedule. The committee should focus on decisions rather than reproduce market news. Each meeting should close with actions, owners, deadlines, and the current planning scenario.
Escalation thresholds should be quantitative where possible—for example, days of coverage, freight increases, delayed vessels, or counterparty exposure—but management judgment remains necessary when security conditions change faster than the data can capture.
Supplier and counterparty scorecard
Supplier performance should be measured across price competitiveness, quality, on-time loading, documentation, claims handling, financial strength, sanctions acceptability, and route resilience. A supplier with a slightly higher price may create lower total cost through dependable execution and fewer claims.
Counterparty limits should incorporate both financial exposure and operational dependence. A small supplier can be critical if it provides a unique grade; a large supplier can create concentration through multiple contracts. Parent guarantees, letters of credit, and insurance reduce some risks but do not replace operational due diligence.
Scorecards should use recent evidence and be updated after every material cargo. The purpose is to inform allocation and negotiation, not merely to rank suppliers once per year.
Implementation roadmap
Within 30 days, map all open and planned cargoes by origin, route, insurer, bank and delivery window; confirm critical inventory and review freight clauses. Within 90 days, qualify alternative origins, agree dashboard definitions and establish scenario triggers. Over the longer term, develop a balanced portfolio of term, formula and spot contracts supported by resilient logistics and financing.
Data governance should be implemented alongside commercial actions. Licensed benchmark access, source archives, unit normalization and version control prevent future reports from mixing illustrative and verified figures. Charts should be generated directly from controlled data tables.
The final objective is not to eliminate volatility. It is to reduce avoidable surprises, preserve choice and make faster decisions with a shared view of price, logistics, finance and risk.
Detailed Country and Trade-Flow Profiles
Purpose: This chapter converts the regional overview into operational country profiles. It focuses on how policy, logistics, finance and crop cycles translate global benchmarks into executable trade.
China: production, consumption and export optionality
China is simultaneously a major producer, consumer, and potential exporter of nitrogen, phosphates, ammonium sulfate, and selected compound fertilizers. Domestic coal and gas economics, environmental controls, agricultural priorities, and port policy shape export availability. Market participants should distinguish theoretical export capacity from product that has completed inspection, customs, and loading requirements.
In urea, Chinese offers can cap regional values when exports are available, but domestic policy can quickly remove that supply. In phosphates, export availability affects India and other Asian importers. China is also the largest sulfur-import market; port inventories and phosphate operating rates influence global sulfur demand. A single “China view” is therefore inadequate—each product requires its own policy and margin analysis.
India: tender-led procurement and subsidy exposure
India influences urea and phosphate markets through large import requirements and government-linked purchasing structures. Urea tenders can create concentrated demand across short loading windows. Supplier qualification, bid validity, payment, vessel nomination and actual awards determine the market effect; announced tender quantities should not be assumed to equal executed imports.
Phosphate demand is connected to subsidy economics and maximum retail pricing. When international costs rise faster than support, importer margins compress, and purchases may be delayed even if farm demand is strong. Monsoon performance, crop acreage, domestic production and port inventory determine how long procurement can be postponed.
Brazil: import dependence, credit and seasonality
Brazil is a major destination for granular urea, MAP and MOP. Large, planted areas and multiple crop cycles create substantial nutrient requirements, but commercial timing depends on grower credit, barter ratios, exchange rates and crop prices. Importers and blenders manage risk across ocean arrivals, port storage and long inland routes.
Brazilian CFR assessments are widely watched, but they are destination specific. Freight from the Persian Gulf, Nigeria, North Africa, the Baltic, the Black Sea, China, or North America varies by route and parcel size. A high CFR midpoint can reflect freight and risk as much as local demand. Port congestion and delivery windows can also separate physical value from benchmark value.
United States and Canada
The United States benefits from comparatively low natural-gas costs and extensive nitrogen infrastructure. Planting schedules, river and rail logistics, import parity, and regional inventory shape domestic values. NOLA references may be quoted in short tons and must be converted carefully before metric comparison. Seasonal weather can cause abrupt local disruptions without affecting global supply.
Canada is central to potash exports and also participates in nitrogen and sulfur trade. Saskatchewan potash depends on mine reliability, railways, and export terminals. Vancouver's sulfur movements can be affected by rail performance, wildfires, and port conditions. Producer guidance provides a strategic outlook but does not replace prompt logistics data.
Morocco, North Africa and the Persian Gulf
Morocco’s integrated phosphate chain makes it a critical buyer of sulfur and exporter of phosphate products. Its scale, resource base, and ports allow it to influence seaborne DAP, MAP, and phosphoric acid markets. North African gas-based nitrogen producers also have a freight advantage into Europe and parts of the Atlantic Basin.
Persian Gulf producers retain strong feedstock positions in urea, ammonia, sulfur and methanol. July’s risk was not primarily nameplate cost but maritime execution through the Strait of Hormuz. Country and plant profiles should therefore include alternative ports, inventory accumulation, vessel access, insurer appetite and banking acceptability.
Southeast Asia, Africa and emerging demand
Southeast Asian fertilizer demand is driven by rice, palm oil, rubber, fruit, and other crops. Potash and NPK demand can be resilient in plantation systems, while currencies and distributor credit influence procurement. China, the Persian Gulf, and regional producers compete via short- and long-haul routes.
African markets offer long-term consumption growth but face constraints in finance, port capacity, bagging, warehousing, and inland distribution. Government programs and food-security initiatives can create large tenders, yet execution risk remains high. Commercial plans should address last-mile logistics and counterparty capacity rather than assume port delivery completes the transaction.
Product Cost and Margin Mechanics
Analytical principle: A benchmark price serves only as a market reference. Commercial margin requires a complete bridge from feedstock and conversion through freight, finance, and realized selling price.
Ammonia and urea cost chains
Conventional ammonia cost is dominated by natural gas, but actual plant economics include energy efficiency, electricity, maintenance, catalysts, labor, carbon, and utilization. Urea adds carbon dioxide integration, conversion, granulation or prilling, storage, and loading. Plants with low feedstock but poor reliability may have a higher effective cost than efficient facilities with moderately higher gas.
Export margin should be calculated from FOB realization less variable production, terminal and commercial costs. Delivered competitiveness adds ocean freight, insurance, and destination charges. When routes are disrupted, a low-cost Persian Gulf plant can temporarily lose delivered advantage to a higher-cost Atlantic origin.
Sulfur and phosphate cost transmission
Sulfur is largely a recovered by-product, so production cost does not set price in the same way as ammonia. Seaborne value reflects refinery and gas-plant supply, forming, storage, producer pricing, freight and phosphate demand. High sulfur increases sulphurous acid costs, which then pass into phosphoric acid and finished phosphate fertilizer.
DAP and MAP margins require phosphate rock, sulfur, ammonia, utilities, conversion yield, maintenance and freight. Integrated producers may transfer value between rock, acid and fertilizer rather than optimize each step independently. Non-integrated producers face greater exposure to spot feedstocks and may curtail earlier when finished-product affordability weakens.
Potash mining and delivered economics.
Potash cost structures include mining or solution mining, processing, maintenance, royalties, taxes, rail and terminal charges. Mine cash cost can be low relative to delivered value, but the distance from Saskatchewan, Russia or Belarus to major buyers makes logistics a substantial component. Product grade and granulation add further differences.
Producer discipline matters because supply is concentrated and new mines take years to develop. Annual capacity does not mean all tonnes are available at every price. Contract allocation, maintenance, rail constraints and destination strategy influence prompt netbacks.
NPK formulation and blending margin
A finished NPK cost model should begin with the precise recipe and nutrient assay. Raw-material tonnage is adjusted for nutrient concentration, moisture and process loss. Conversion, steam, utilities, additives, packaging, labor, quality control, finance and freight must then be included. Generic percentage cost shares are useful only as an initial screen.
Blenders can face basis risk when finished products are sold at fixed prices while raw materials float. Escalation clauses should name specific indices, averaging periods, units, and freight treatment. Margin reporting should distinguish inventory gains or losses from manufacturing performance.
Methanol realization bridge
Methanol posted prices are starting references. Realized value may reflect discounts, customer formulas, freight, terminal costs, product loss, and currency. A North American posting and a Chinese spot value are not directly comparable without an understanding of their respective market conventions.
Producer margin depends on gas or coal feedstock, plant efficiency, operating rate and destination. Downstream methanol-to-olefins, formaldehyde, acetic acid and fuel economics influence the demand side. Commercial reporting should separate posted, spot, contract and net realized prices.
Sensitivity analysis
Sensitivity models should vary one factor at a time and in combinations: product price, gas, sulfur, ammonia, freight, FX, interest and utilization. The objective is to identify which variable can breach a margin or liquidity threshold, not to imply false precision in forecasting.
For major purchases, the buyer should calculate delivered cost under base, stress and relief assumptions. For production, management should compare run, curtail and import alternatives. Each model should state source date, unit, incoterm and whether a value is observed or assumed.
Procurement and Contracting Playbook
Portfolio design
A resilient procurement portfolio combines base-load term contracts, formula-linked agreements and tactical spot purchases. Term supply protects continuity, formulas share market risk and spot cargoes preserve flexibility and price discovery. The appropriate mix depends on product criticality, storage, lead time and market liquidity.
Diversification should be measured across origin, plant, port, corridor, vessel class, bank and insurer. Multiple contracts do not reduce risk when they depend on the same constrained route. Allocation decisions should reward both competitive price and demonstrated execution.
Pre-tender preparation
Before issuing an inquiry, the buyer should define product specification, quantity tolerance, parcel size, loading or delivery window, destination capability, inspection, payment and acceptable origins. Unclear requirements create non-comparable bids and post-award disputes.
The bid sheet should require a complete price basis: incoterm, named port, freight inclusion, insurance, taxes, currency, validity and escalation. Suppliers should disclose producer, load terminal and expected vessel class where route risk is material.
Offer normalization and award.
Offers should be normalized to a common delivered basis and nutrient basis. The calculation should incorporate quality differences, freight, insurance, finance, duty, port cost, inland transport and expected loss. A risk-adjusted view can quantify delay or performance costs, provided the assumptions are transparent.
Award decisions should record both commercial and operational reasoning. Splitting volume can reduce concentration but may raise unit freight or complicate quality. The selected strategy should be linked to inventory coverage and alternative supply.
Essential contract clauses
Contracts should define specification, tolerance, inspection method, sampling, laycan, nomination, loading rate, discharge rate, demurrage, title, risk transfer, payment, sanctions, force majeure, safe port, deviation and claims. Ambiguity is most expensive during disruption.
Index-linked pricing requires precise benchmark name, publication, unit, averaging period, currency and fallback if the assessment is unavailable. Freight adjustment, quality premium and taxes should not be left to informal interpretation.
Performance and claims
Supplier performance should be measured against on-time loading, documentation, quality, quantity, responsiveness and claim resolution. Claims procedures must specify notice period, evidence and independent inspection. Samples should be retained in accordance with an agreed chain of custody.
After each material cargo, procurement, logistics and quality teams should complete a closeout. Lessons on port performance, vessel suitability, documents and product condition should update future qualification and scorecards.
Ethics, sanctions and compliance
Due diligence should cover ownership, control, sanctions, anti-bribery, beneficial owners, vessel history and payment chain. Commercial urgency does not remove legal obligations. Where the legal position is uncertain, the transaction should be escalated to qualified counsel.
Compliance clauses do not replace pre-transaction screening. Banks and insurers may use policies stricter than law; their acceptance should be confirmed early. Records should support the organization’s decision and source of information.
Inventory and Working-Capital Framework
Inventory segmentation
Inventory should be divided into operational stock, safety stock, strategic stock, committed transit, and optional supply. Operational stock supports normal production or sales. Safety stock covers delivery variability. Strategic stock protects against low-probability disruption. Transit stock is counted only based on realistic arrival probabilities.
Each product requires its own policy. Sulfur may be plant-critical but constrained by storage and safety. Urea is liquid in trade but volatile. Potash is relatively stable but long-haul. NPK has grade-specific obsolescence and caking risk. A single days-of-cover target is therefore inappropriate.
Reorder points and trigger bands
Reorder points should account for expected demand during lead time, lead-time variability, and the service target. Market triggers can temporarily raise or lower coverage bands. Confirmed route disruption, falling vessel departures, or supplier outage can justify additional safety stock; weaker demand and improving logistics can reduce it.
Triggers should be defined before a crisis. If management changes coverage without recorded evidence, the organization may repeatedly buy high and sell low. A formal band preserves discipline while allowing authorized exceptions.
Working-capital calculation
Working capital includes product value, freight, duties, inventory days, transit days, receivables and payables. Higher prices and longer voyages create a compound effect: more cash is tied in each metric ton for a longer period. Insurance and financing fees also rise.
Finance should forecast cash by cargo and product, not only by monthly aggregate. Letters of credit, margin deposits, prepayments and delayed documents can create timing peaks. Liquidity should be secured before procurement windows become urgent.
Inventory valuation and price risk
High-cost inventory is exposed when replacement values fall. The organization should separate physical security from speculative length. Back-to-back sales, price formulas, hedges where available, and measured coverage reduce inventory mismatch.
Valuation reports should distinguish realized margin, replacement margin, and accounting inventory effects. A profitable historical sale can conceal a weak replacement position, while an accounting loss can coexist with improved future purchasing economics.
Storage and product integrity
Storage limits are both physical and financial. Urea and NPK require moisture and caking control. Sulfur requires fire, dust and environmental management. Methanol requires appropriate tanks and safety systems. Potash quality can be affected by moisture and segregation.
Warehouse capacity, handling rate, bagging, blending and discharge constraints should be incorporated into inventory strategy. Buying beyond usable capacity transfers risk from the market to operations.
Inventory governance dashboard
- Available, committed, in-transit and at-risk volume by product and location.
- Days of cover under base and stress demand.
- Expected arrivals with vessel and document status.
- Average cost, replacement cost and potential inventory exposure.
- Storage utilization, quality exceptions and aging.
- Supplier, origin and corridor concentration.
Quality, Specification and Claims Management
Specification governance
Every purchase should reference an approved product specification and test method. Chemical assay alone is insufficient: physical properties determine handling, blending and field application. Specifications should distinguish guaranteed limits, typical values and information-only parameters.
Changes in the producer, plant, production route, or raw materials can affect performance even when the nominal grade remains unchanged. Supplier change control and sample approval are important for critical applications and branded products.
Urea and nitrogen-product quality
Granular and prilled urea differ in particle size, hardness and application behavior. Relevant parameters include nitrogen content, moisture, biuret, particle-size distribution, crushing strength and free ammonia. Agricultural and industrial uses may require different tolerances.
Ammonium sulfate can be crystalline, compacted, or granular and may differ depending on the production route. Nitrates and UAN require concentration and safety controls. Comparing products on price without normalizing nutrient concentration and physical form can create false savings.
Sulfur and phosphate quality
Sulfur may be granular, formed, lump, or molten. Purity, ash, acidity, moisture, particle condition, and handling losses affect use. Dust and fines can create safety and environmental issues. Sampling a heterogeneous cargo requires an agreed and representative method.
DAP, MAP and phosphate rock require chemical and physical testing appropriate to the destination. Total and available phosphate, nitrogen, moisture, particle size, impurities and cadmium can be commercially material. Regulatory limits may vary by market.
Potash, NPK and methanol
MOP and SOP differ chemically and agronomically. Grade, potassium content, moisture, particle size and color may affect use and customer expectation. NPK requires verification of each declared nutrient, physical uniformity and resistance to caking and segregation.
Methanol quality is governed by purity and controlled impurities, with separate safety and handling requirements. Tank cleanliness and previous cargo are critical. Chemical contamination can render a cargo unsuitable even when quantity and delivery are correct.
Sampling, inspection and laboratories
Sampling plans should specify location, timing, increment count, composite preparation, sealing and chain of custody. Loading inspection can prevent disputes that are difficult to resolve after discharge. Independent inspectors should be competent for the product and port.
Laboratory methods must be named and compatible. When buyer and seller results differ, the contract should define the referee laboratory and tolerance. Retained samples should remain sealed for the claim period.
Claims process
Claims require timely notice, evidence, mitigation and quantification. Quantity claims may depend on draft survey, shore scale or tank measurement. Quality claims require samples, certificates, photographs, handling records and laboratory reports. Delay claims require contractual and operational records.
Commercial teams should avoid informal settlement before technical review. The organization should record the root cause, recovery, and corrective action so that repeated losses do not change supplier qualification or contract terms.
Risk Register and Internal Controls
| Risk | Example event | Primary control | Owner |
|---|---|---|---|
| Price | Benchmark rises or falls rapidly | Coverage bands and indexed contracts | Commercial |
| Freight | Route or vessel cost spikes | Alternative routes and freight clauses | Logistics |
| Supply | Plant outage or export restriction | Supplier diversification and safety stock | Procurement |
| Quality | Off-spec cargo | Approved specifications and inspection | Quality |
| Credit | Customer or supplier default | Limits, security and monitoring | Finance |
| FX | Local currency depreciation | Currency matching and hedging policy | Finance |
| Sanctions | Party or vessel becomes restricted | Screening and legal review | Compliance |
| Operational | Port or warehouse cannot handle cargo | Capability checks and contingency plan | Operations |
Risk scoring methodology
Risks should be scored by likelihood, financial impact, operational impact, and speed of onset. A low-probability event may require strong controls if it can stop production or create legal exposure. Speed matters because some risks allow time to source alternatives while others require immediate response.
Scores should reflect residual risk after controls, not the uncontrolled scenario. Assumptions, evidence, and review date should be recorded. The purpose is prioritization and action rather than a mathematically precise forecast.
Price and basis risk
Price risk includes movements in the selected benchmark. Basis risk arises when the organization’s actual product, location, or timing differs from the benchmark. A hedge or formula can reduce benchmark risk while retaining exposure to freight, quality, or regional spread.
Controls include matched purchase and sale formulas, coverage limits, scenario analysis, and approval for open positions. Reports should separate physical requirement from discretionary market exposure.
Supply-chain and geopolitical risk
Supply risk can arise from plant failure, export policy, maritime attack, port closure, labor action, weather, or vessel shortage. Supplier diversification and inventory are common controls, but both have cost. Contingency plans should identify alternative products and destinations before a disruption occurs.
Security information should be sourced from authoritative maritime and government channels. Market rumor can guide an investigation but should not, by itself, trigger irreversible action.
Counterparty and credit risk
Supplier default can remove critical volume; customer default can convert inventory into an unplanned position. Limits should incorporate exposure, financial strength, country risk, payment security and operational dependence. Prepayment requires particular care.
Credit insurance, letters of credit, guarantees and collateral can reduce loss but introduce issuer and documentation risk. Exceptions should be approved with a clear business rationale and an expiry date.
Control testing and incident review
Controls should be tested through sample transactions, document review and scenario exercises. A policy that cannot be executed under time pressure is not an effective control. Owners should understand both the required action and escalation route.
After incidents, a structured review should identify the root cause, the control failure, the financial impact, and the corrective action. Lessons should be updated in contracts, scorecards, and training rather than remain in a narrative report.
Market Monitoring and Early-Warning System
Dashboard architecture
The monitoring system should combine price, physical flow, logistics, demand, financial, and geopolitical indicators. Prices describe the outcome; physical indicators often provide earlier warning. The dashboard should show the source, timestamp, unit, and whether the data are observed, estimated, or internal.
A small set of trusted indicators is more useful than a large ungoverned feed. Each metric should have an owner, an update frequency, a threshold, and a corresponding decision. Historical values should be retained to identify regime changes.
Nitrogen indicators
- India tender announcements, awards, shipment windows and executed volume.
- Chinese urea and phosphate export policy, inspections and offers.
- Persian Gulf, North African, Chinese and Atlantic production outages.
- Urea FOB/CFR benchmark spreads and destination netbacks.
- Henry Hub, TTF and other relevant feedstock indicators.
- Brazil imports pace, NOLA seasonality and regional inventory.
Ammonia and methanol indicators
- Major plant outages, restarts and planned maintenance.
- Specialized vessel availability and terminal schedules.
- Monthly contract settlements and spot assessments.
- Downstream operating rates and industrial margins.
- Gas or coal feedstock economics by production region.
- Posted prices, discounts and realized-price evidence.
Sulfur and phosphate indicators
- Persian Gulf producer prices, cargo offers and vessel departures.
- Chinese sulfur port inventories and phosphate operating rates.
- Moroccan sulfur procurement and phosphate export programs.
- Sulfur freight by route and parcel size.
- India DAP procurement and subsidy economics.
- Brazil MAP import pace and grower affordability.
Potash and NPK indicators
- Producer sales and production guidance.
- Canadian rail and terminal performance.
- Russian and Belarusian trade-route and sanctions developments.
- China and India contract negotiations.
- Brazil, Southeast Asia and North America demand indicators.
- Raw-material replacement cost for major NPK formulations.
Logistics and security indicators
The logistics dashboard should track vessel nominations, actual departures, congestion, freight ranges, war-risk premiums, incident reports and route guidance. A falling benchmark is not a relief signal if departures remain constrained.
IMO, flag-state, insurer and trusted security updates should be distinguished from commercial market commentary. The dashboard should highlight changes that affect crew safety, legal transit or insurance rather than attempt to predict political outcomes.
Alert levels
A green status indicates normal monitoring and approved coverage. Amber indicates a threshold breach that requires review—such as widening freight, delayed vessels or falling inventory. Red indicates a confirmed condition requiring action, such as loss of a supplier, closure of a route or breach of minimum stock.
Alerts should have expiry and review times. Without closure rules, dashboards remain permanently amber and lose value. Every red alert should record management action and communication.
Commercial Decision Framework
From market view to decision
A market report becomes valuable when it changes a decision. The commercial process should begin with the business requirement, define acceptable risk, evaluate alternatives, and document the selected action. Market direction is one input, not the conclusion.
For example, a bullish view of urea does not automatically justify immediate full coverage. The decision depends on inventory, customer commitments, financing, route risk, and the cost of being wrong. The framework makes these trade-offs explicit.
Buy, wait or split
A buy decision is appropriate when the physical requirement is firm, coverage is below target, or execution risk outweighs the potential price decline. Waiting is appropriate when stock is sufficient, offers are poorly executable, or downside evidence is strong. Splitting reduces timing risk and is often the default under uncertainty.
The chosen action should specify the quantity, price basis, window, origin, expected landed cost, scenario, and invalidation trigger. This allows for later evaluation of decision quality rather than judging solely by the price outcome.
Supplier allocation decision
Allocation should consider the risk-adjusted total value—price, quality, reliability, documentation, compliance, freight, and relationships all matter. A weighted score can support judgment, but weighting should reflect product criticality and be approved before bids are opened.
New suppliers may receive trial quantities with enhanced inspection. Strategic suppliers may receive base allocation while competing for additional volume. Poor performance should have a documented consequence.
Sales and customer strategy
Sales commitments should be aligned with procurement and logistics. Fixed-price sales against floating purchases create risk, while destination commitments can become unprofitable if freight rates change. Contracts should reflect the organization’s ability to source and deliver.
Customer segmentation can identify where reliability, credit, or technical service justifies differentiated terms. Credit risk and operational priority should be integrated into allocation during shortage.
Investment and capability decisions
Persistent logistics or quality constraints may justify investment in storage, bagging, blending, terminals, laboratory capability or digital monitoring. The business case should compare capital cost with avoided demurrage, lost sales, inventory reduction and resilience.
Not every volatility event warrants permanent capacity. Scenario analysis should test utilization under normal and disrupted conditions. Partnerships and contracted capacity may provide flexibility where ownership would create low utilization.
Decision record template
- Business requirement and deadline.
- Verified market evidence and source date.
- Options considered and normalized landed cost.
- Key risks, scenario and trigger.
- Selected action, owner and approvals.
- Expected cash and margin effect.
- Review date and actual outcome.
Final management perspective
The fertilizer and petrochemical markets covered in this report are exposed to structural volatility because energy, agriculture, policy and maritime trade interact. The organization cannot control these drivers, but it can control data quality, portfolio design, contract clarity, inventory discipline and response speed.
The strongest commercial position is not always the lowest immediate price. It is the ability to maintain supply, protect liquidity, serve customers and preserve alternatives across multiple scenarios. That principle links the market analysis to the operational playbooks in these extended chapters.
Product-Specific Procurement Strategies
Urea strategy
Urea procurement should balance tender-driven global volatility with broad availability of origins. Base requirements can be covered through qualified term suppliers, while seasonal or customer-linked volume is staggered across shipment windows. Persian Gulf offers should be evaluated against route execution, while Atlantic and Chinese alternatives should be compared on a normalized delivered value basis.
The buyer should track granular versus prilled specification, agricultural versus industrial requirements, parcel size, and destination. A low FOB price is not preferred when freight, delays, or quality issues increase the expected cost. India's tender and Brazil's demand scenarios should be reflected in the coverage bands.
Ammonia strategy
Ammonia requires terminal and vessel compatibility, making supplier substitution slower than for dry bulk. Procurement should secure a reliable core schedule and maintain technically qualified alternatives. Contract formulas should match the relevant regional benchmark and freight basis.
Outage response plans should include inventory, substitute downstream feedstocks where technically possible, terminal slots and gas-carrier availability. Low-carbon ammonia should be contracted under a separate certification and carbon-intensity framework.
Sulphur strategy
Sulfur coverage should be tied to downstream plant criticality. A phosphate producer may accept higher inventory cost to avoid shutdown. Supplier diversification should span the Persian Gulf and alternative origins where quality and freight permit. Freight capacity may need to be secured with the commodity rather than afterward.
The purchase specification should control form, purity, moisture, ash and handling. Transit and terminal stock should be reconciled against consumption weekly during disruption. Price targets must be secondary to minimum operational security when executable supply is constrained.
DAP, MAP and phosphate strategy
Phosphate procurement should monitor sulfur, ammonia, and destination demand rather than rely only on the finished benchmark. India-linked DAP and Brazil-linked MAP require different timing and commercial structures. Buyers should qualify Morocco, the Persian Gulf, China, and other origins according to specifications and routes.
Nutrient cost and agronomic substitution should be evaluated before changing product. Contract terms should address cadmium or impurity limits, available phosphate, granulation, and inspection. High replacement cost may justify staggered buying rather than complete deferral.
Potash strategy
Potash’s relative stability supports normal coverage, but concentration and long logistics require planning. MOP and SOP must be managed separately. Canadian reliability, Russian and Belarusian compliance complexity, and regional contracts should be included in supplier allocation.
Price-sensitive negotiations should use licensed benchmarks. Public producer guidance can support the market view but is not a substitute for exact spot evidence. Buyers should avoid building inventory solely because annual demand is forecast to grow.
NPK and methanol strategy
NPK should be purchased based on verified formula, quality, and cost per usable nutrient. Where blending capability exists, the buyer can compare finished-product imports with local manufacture from raw materials. Seasonal delivery and caking risk influence the economic quantity.
Methanol procurement should separate posted reference, discount, freight, and realized landed cost. Terminal compatibility, tank availability, previous cargo, and safety documents must be confirmed. Currency risk is material when formulas use European or local references.
Route and Logistics Reference Guide
Persian Gulf to Asia
Routes from the Persian Gulf to India, China and Southeast Asia can offer competitive distance for urea, ammonia, sulfur and methanol. July security conditions changed the risk profile: vessel willingness, flag, ownership, insurer and transit timing became critical. Freight ranges should be recorded with the exact loading area, destination and parcel size.
Alternative loading or transshipment may reduce a specific risk but can add handling, documents and cost. Buyers should confirm whether the offered route is contractually permitted and operationally proven.
Persian Gulf to Europe and the Americas
Longer voyages magnify the effects on vessel employment and insurance. The route may involve the Strait of Hormuz, the Red Sea, or Cape alternatives, depending on the destination and security. Cape diversion increases sailing time and bunker consumption but can reduce exposure to the Red Sea.
For Brazil and the US Gulf, Persian Gulf cargoes compete with Atlantic origins. Netback analysis should include the probability of delay and the value of delivery timing, not only the quoted freight.
North Africa and Mediterranean routes
North African nitrogen and phosphate producers have short access to Mediterranean and European markets and competitive Atlantic routes. Port performance, parcel size and product programs influence availability. Morocco’s sulfur imports and phosphate exports create two-way bulk logistics.
Mediterranean routes can provide alternatives when trade in the Red Sea or Persian Gulf is disrupted, but regional congestion and seasonal vessel demand should be monitored.
Baltic and Black Sea routes
Baltic and Black Sea origins can supply urea, nitrates, sulfur, and potash to Europe, Africa, and Latin America. Commercial advantages must be adjusted for sanctions, banking, insurer acceptance, vessel ownership, and physical security.
Documentation and payment chain confirmation should occur before the fixture. Route or port substitution after contract can change duty, sanctions analysis, and freight responsibility.
Canada and the Pacific
Canadian potash and sulfur depend on rail transport to export terminals, then on long-haul ocean routes to Asia or Latin America. Mine output, railcars, terminal storage, weather, and wildfire are linked. A disruption inland can affect ocean schedules even when the vessel market is available.
Buyers should track actual rail and terminal performance alongside annual producer guidance. For critical delivery windows, alternative terminal or origin capability has strategic value.
Destination-port readiness
Before nomination, the destination should confirm draft, berth, cranes, grabs, discharge rate, storage, customs, bagging and inland evacuation. A port may accept the vessel but lack the capacity to discharge within contractual time.
Logistics plans should include holiday calendars, seasonal weather, traffic congestion, document cutoffs, and emergency contacts. Destination failures can erase savings achieved in commodity negotiation.
Route comparison checklist
- Named loading and discharge ports, not only regions.
- Product, parcel size and compatible vessel class.
- Expected sailing time and route alternatives.
- War-risk, cargo insurance and insurer acceptance.
- Port cost, expected waiting and demurrage terms.
- Banking, sanctions and documentation requirements.
- Probability of on-time delivery to the business need date.
Financial KPIs and Performance Measurement
Procurement KPIs
Procurement performance should not be measured solely against a benchmark. Useful KPIs include normalized landed cost, percentage of volume within approved strategy, supplier concentration, on-time loading, quality acceptance and contract coverage. Benchmark comparison should match product, basis and timing.
Savings should distinguish market movement from negotiated value. Buying after the market falls is not automatically procurement savings; paying below a verified comparable reference may be. Avoided disruption can be valuable even when it is difficult to present as a simple discount.
Logistics KPIs
Logistics should track freight by route and vessel class, demurrage per metric ton, on-time arrivals, port waiting time, discharge performance, insurance premiums, and document cycle time. Route deviations and security delays should be coded separately from normal operational performance.
A lower freight rate that results in higher demurrage or late-delivery losses is not an improvement. Total logistics cost and service should be evaluated together.
Inventory KPIs
Core metrics include days of available cover, days of total cover, inventory aging, storage utilization, in-transit delay, average cost, replacement cost, and write-down exposure. Available and at-risk stock should be reported separately.
Stockout incidents and emergency purchases reveal whether coverage was adequate. Excess aging and quality losses reveal whether the policy was too conservative or poorly executed.
Margin and working-capital KPIs
Commercial margin should be reported on realized and replacement bases. Working-capital metrics include cash conversion cycle, inventory days, receivable days, payable days, letters of credit utilization, and cash committed to transit.
Product and freight volatility can make monthly averages misleading. Reports should highlight peak liquidity, stress-case requirements and open price or FX positions.
Risk and control KPIs
Risk metrics include volume from top origins and suppliers, unhedged FX, uninsured exposure, sanctions-screening exceptions, overdue claims, red alerts and unresolved control actions. A risk KPI should trigger ownership and review rather than remain descriptive.
Near misses are important. A blocked payment resolved before loss or a quality issue caught before loading should be recorded because it tests the control system.
Balanced scorecard
A balanced commercial scorecard should combine cost, service, quality, cash and risk. Overweighting cost encourages fragile decisions; overweighting security can create excessive inventory and poor margins. Management should approve weights based on strategy and product criticality.
Targets should be reviewed when the market regime changes. During acute Persian Gulf disruption, service and liquidity may deserve greater weight; after normalization, cost and inventory efficiency can return to prominence.
Ninety-Day Implementation Plan
Objective: Convert the report into an operating rhythm with defined owners, data, thresholds and decisions.
Days 1–15: establish the baseline
Create a complete map of open purchases, sales, inventory and transit by product, supplier, origin, route, bank and insurer. Confirm units and incoterms. Identify all unverified data used in recurring reports and replace it with controlled sources or explicit assumptions.
Review critical stock against operational minimums. Confirm vessel status, documents and expected arrival for high-risk cargoes. Escalate sanctions, credit or quality exceptions.
Days 16–30: define policy and triggers
Approve product-specific coverage bands, supplier concentration limits and decision rights. Define green, amber and red triggers for price, freight, inventory and route risk. Assign owners and update frequency for the market dashboard.
Standardize bid sheets, offer-normalization models and contract checklists. Confirm who can approve deviations, additional insurance, alternate ports and emergency purchases.
Days 31–60: diversify and test
Qualify alternative suppliers and routes for critical products. Conduct trial transactions where appropriate, with enhanced inspection and document review. Test financing, insurer and terminal acceptance before relying on an alternative in a crisis.
Run a tabletop exercise for a Persian Gulf transit interruption, a major supplier outage and a customer credit event. Record decisions, information gaps and corrective actions.
Days 61–90: institutionalize
Launch the cross-functional market and risk review. Integrate procurement, logistics, inventory, finance, quality and compliance KPIs. Establish version-controlled monthly reporting and a formal scenario review.
Complete supplier scorecards and allocate future volume in line with performance and concentration policy. Approve the long-term capability roadmap for storage, laboratory, digital monitoring or logistics partnerships.
Required deliverables
- Controlled market-data register and source archive.
- Product coverage and inventory policy.
- Supplier, origin and corridor concentration map.
- Standard tender, contract and landed-cost templates.
- Risk register with owners and residual scores.
- Early-warning dashboard with trigger definitions.
- Quarterly supplier scorecard and incident review process.
- Management decision record and action tracker.
Success criteria
The plan is successful when management can state, for every critical product, how much is truly available, what is arriving, which risks can stop delivery, and what action is triggered. Commercial offers should be comparable on a controlled landed-cost basis, and exceptions should be visible before commitment.
Success is also measured by behavior: fewer emergency purchases, clearer contracts, faster claims, lower avoidable demurrage, disciplined inventory and documented decisions. The framework should remain practical; indicators or approvals that do not influence action should be simplified.
Beyond ninety days
After the initial implementation, the organization should refine thresholds based on actual outcomes, expand supplier alternatives, and integrate reporting with financial planning. The annual strategy should revisit storage, logistics, financing, and data investment.
The market will continue to change. The durable advantage is an operating system that converts new information into timely, controlled decisions while preserving supply and liquidity.
Complete Sources & References
Argus Nitrogen — supplied issues
2, 16, 23 and 30 July 2026; urea, nitrogen products and freight. Public methodology:
Public source
Argus Ammonia — supplied issues
2, 16, 23 and 30 July 2026; regional ammonia prices and market commentary. Public product information:
Public source
Argus Sulfur — supplied issues
9 and 30 July 2026; sulfur prices, trade and freight. Public product information:
Public source
Nutrien — Full-Year 2025 Results and 2026 Guidance
Potash shipments and producer guidance.
Public source
Nutrien — First Quarter 2026 Results
Producer and market outlook.
Public source
The Mosaic Company — Q1 2026 Results (SEC)
Potash sales, production and 2026 expectations.
Public source
Canpotex — Potash Sales Commitment
Offshore potash availability through 30 June 2026.
Public source
Methanex — Regional Methanol Pricing
July 2026 posted prices.
Public source
US EIA — July 2026 Short-Term Energy Outlook
Natural gas, energy and market assumptions.
Public source
International Monetary Fund — July 2026 WEO Update
Global growth and trade outlook.
Public source
International Maritime Organization — Strait of Hormuz
8 July 2026 safety and stranded-vessel statement.
Public source
International Maritime Organization — Red Sea piracy
6 July 2026 maritime-security statement.
Public source
Market Conventions and Glossary
Pricing and delivery terms
| Term | Meaning |
|---|---|
| FOB | Free on Board: seller delivers cargo on board at the named loading port; ocean freight is normally the buyer's responsibility. |
| CFR | Cost and Freight: seller pays ocean freight to the named destination; cargo insurance is normally the buyer's responsibility. |
| CIF | Cost, Insurance and Freight: seller pays freight and minimum cargo insurance to the named destination. |
| Netback | Estimated value at origin after deducting freight and other delivery costs from a destination value. |
| Spot | Transaction or assessment for prompt/near-term delivery rather than a long-term contract. |
| Posted price | A published reference price that may differ from realized prices after discounts and contract terms. |
Product abbreviations
| Abbreviation | Definition |
|---|---|
| AN | Ammonium nitrate |
| CAN | Calcium ammonium nitrate |
| UAN | Urea ammonium nitrate solution |
| DAP | Diammonium phosphate |
| MAP | Monoammonium phosphate |
| MOP | Muriate of potash/potassium chloride |
| SOP | Sulfate of potash/potassium sulfate |
| NPK | Compound fertilizer containing nitrogen, phosphorus and potassium |
Units and comparison rules
USD/metric ton means US dollars per 1,000 kilograms. MMBtu means one million British thermal units. Ranges are shown as low–high and chart midpoints are arithmetic averages used only for visualization. FOB, CFR, CIF and domestic values are not directly interchangeable without freight and other adjustments. Posted, contract, spot and assessed prices must be labeled separately.
Disclaimer and Copyright
Disclaimer
This public edition is provided for general market intelligence and educational purposes only. It is not investment, legal, tax, accounting, sanctions, insurance, or trading advice. Commodity assessments, forecasts, and scenarios are subject to revision and may differ from executable transactions due to specifications, volumes, timing, Incoterms, credit, freight, insurance, and local market conditions. Users must independently verify all information before entering into a transaction.
Argus data are derived from licensed or user-supplied publications and remain subject to Argus Media’s applicable copyrights, terms and methodologies. This report does not redistribute full proprietary publications and is not a substitute for a subscription. Public hyperlinks are provided for source identification and access to the methodology.
Copyright
© 2026 Green Gubre Group. All rights reserved. This report may be accessed and shared through official Green Gubre Group channels. No part may be reproduced, republished, modified, or commercially distributed without prior written permission, except for brief quotations permitted by law and properly attributed. Third-party names, trademarks, and source materials remain the property of their respective owners.