GLOBAL FERTILIZER & PETROCHEMICAL MARKET REPORT
September 2026
Public September price observations and independent commercial analysis
Author: Saman Memarpour
1. Executive Summary
| Market | September evidence | Verified reference | Interpretation |
|---|---|---|---|
| Urea | USDA 18 September | USD 1,196.67/metric ton | Pacific Northwest distributor asking average |
| Ammonia | KBR 29 September | 1.2 million metric tons/year planned | Future capacity, not prompt availability |
| MAP | USDA 18 September | USD 1,362.09/metric ton | Regional distributor asking average |
| Potash red | USDA 18 September | USD 760.59/metric ton | 0-0-60 FOB distributor basis |
| Methanol | September valid posting | USD 1,414 / 550 / 525 per metric ton | North America / Asia Pacific / China |
| Energy | EIA September forecast | 2026 Henry Hub USD 3.25/GJ | Annual forecast, not realized September |
| Freight | Cargo specific | No published numerical series | Require executable quotation |
Executive priorities
- Prioritize firm customer requirements and executable offers. Monitor official Indian procurement events, but do not assign them a dominant global price effect without verified award and shipment evidence.
- Separate commodity price, freight, insurance, and financing in every landed-cost decision, and keep nominal production distinct from executable, deliverable supply.
Management interpretation of the month
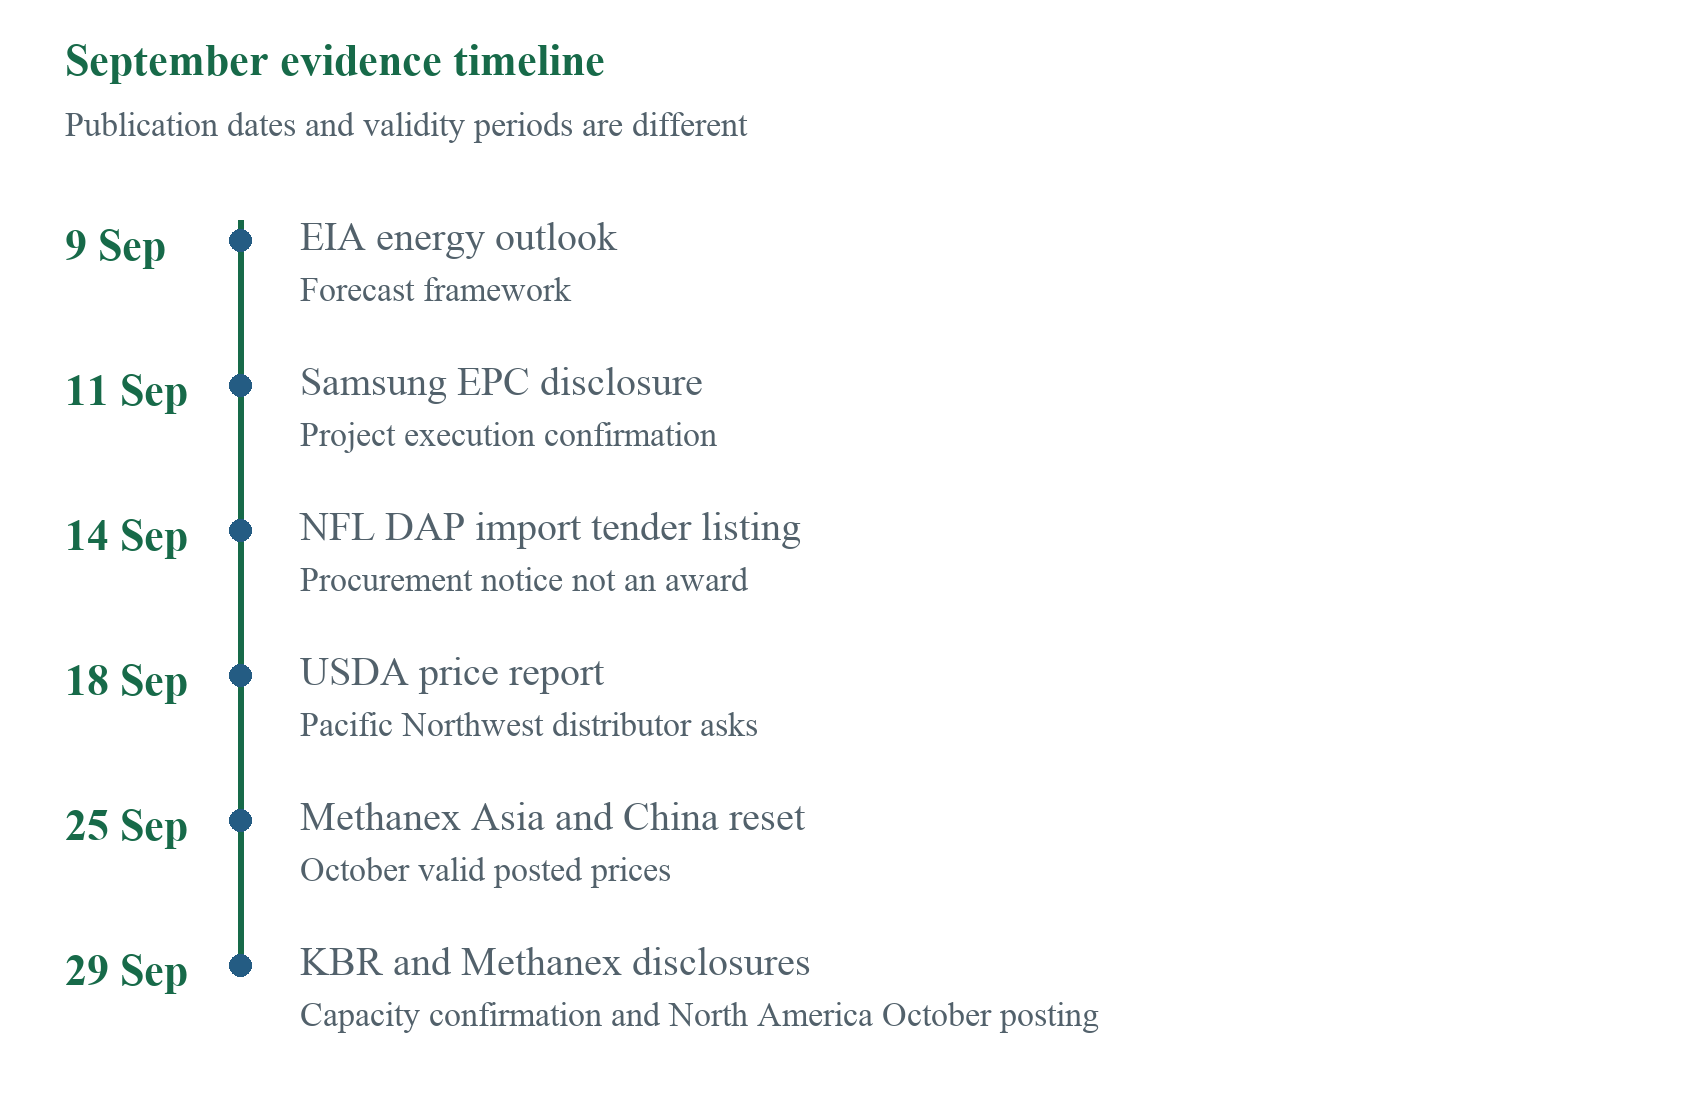
KBR’s 29 September announcement confirms a planned SABIC AN ammonia plant of 1.2 million metric tons per year and an increase in total urea capacity from 4.8 to 7.4 million metric tons per year. Samsung’s 11 September EPC disclosure gives a project completion target of 2030. These are future project commitments, not September production, merchant availability, or guaranteed delivery dates. Source: KBR capacity confirmation. Source: Samsung completion horizon
2. Macroeconomic and Energy Context
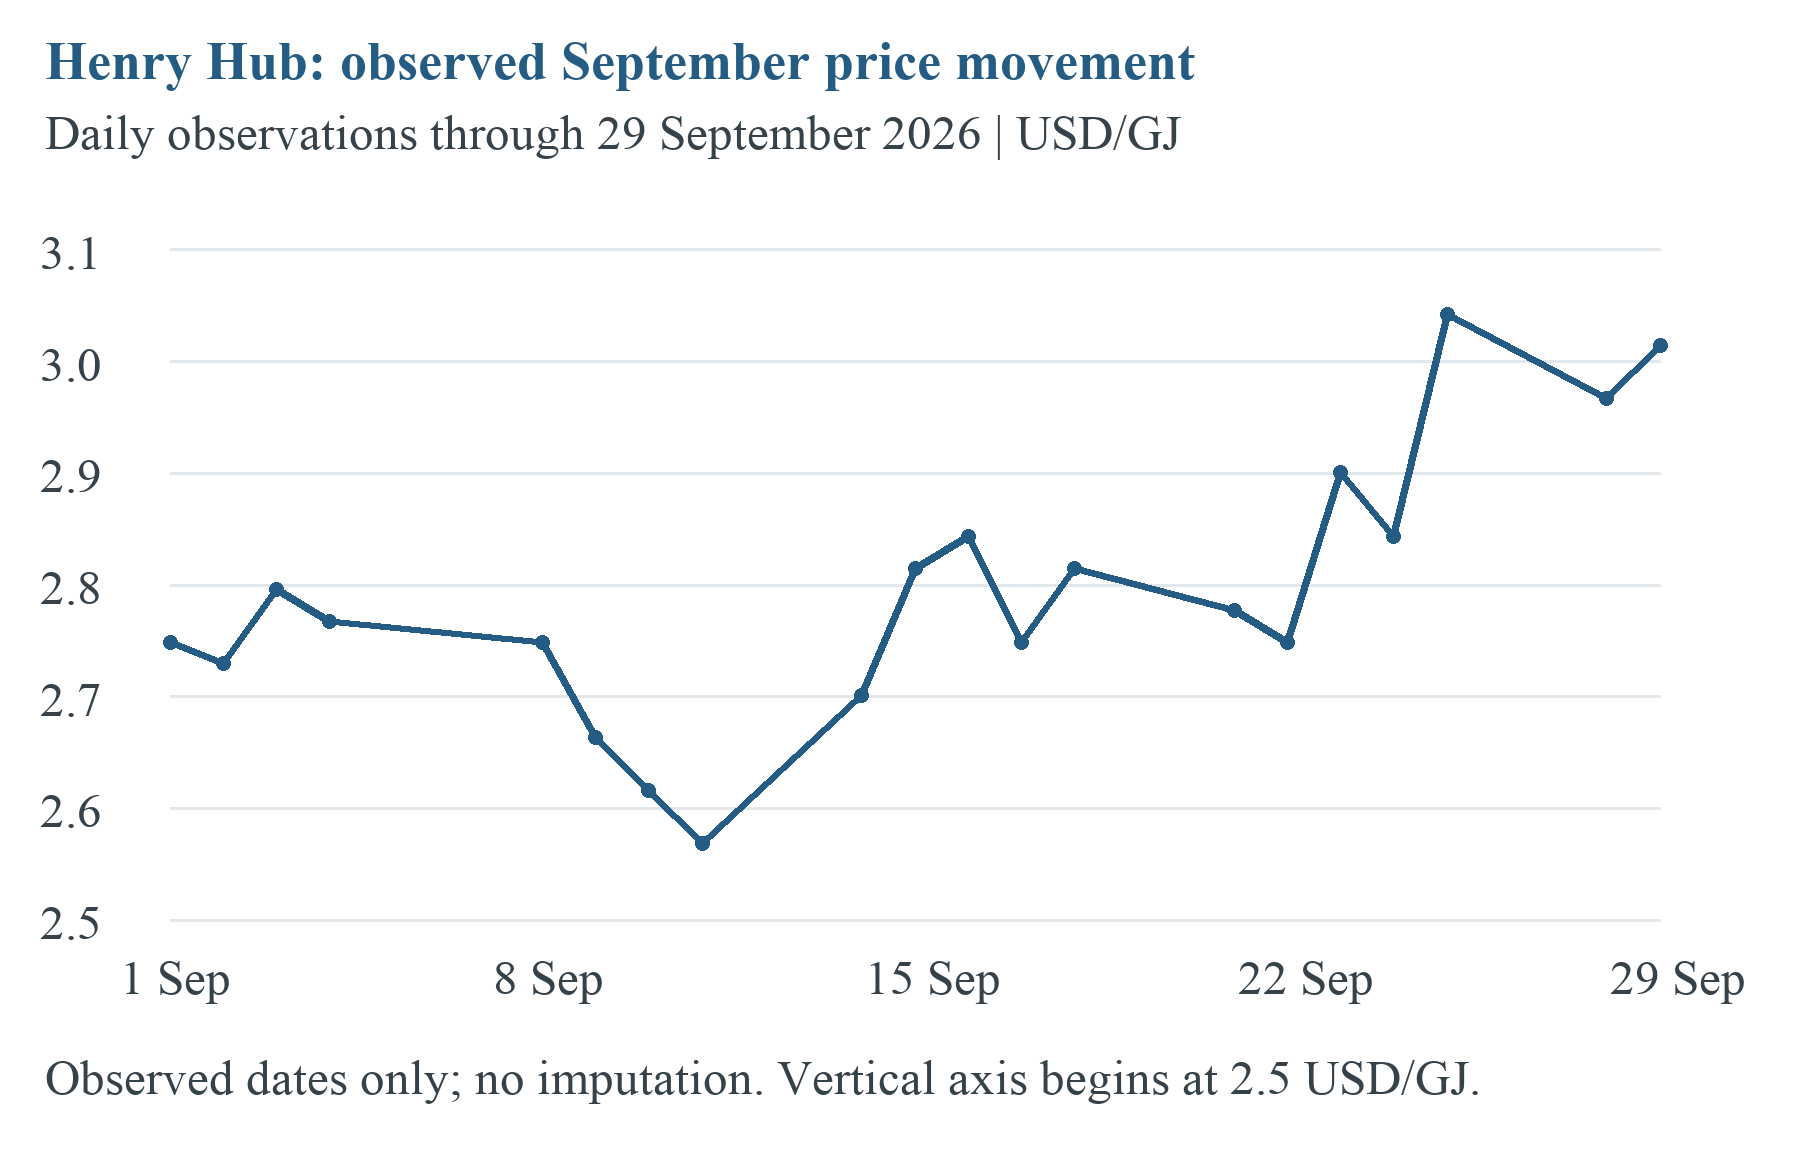
Figure 2. Daily Henry Hub observations for 1–29 September 2026, converted to USD/GJ. Missing dates are not estimated; 30 September was unavailable in the cited release. This is an observed price series, not the annual forecast.
Source: EIA daily public observations
The daily series contains 20 published observations. The first-to-last movement is +9.7%; this is not a complete calendar-month return. Original graphics connect observations only, without filling missing dates. EIA daily series
Metric conversion reference: the original EIA energy quantity corresponds to 1.055056 GJ. The original USDA mass quantity corresponds to 907.18474 kg. NIST conversion tables
The report does not infer fertilizer demand from a global GDP forecast. Purchasing decisions should use customer requirements, crop economics, and confirmed product availability. The dated energy forecast above is retained as a separately labeled planning input.
| Indicator | September vintage | Commercial use |
|---|---|---|
| Henry Hub 2026 annual average | USD 3.25/GJ forecast | Planning sensitivity only |
| Henry Hub 2027 annual average | USD 3.11/GJ forecast | Forward scenario only |
| EIA publication | 9 September 2026 | Forecast vintage must remain visible |
Energy reference: annual Henry Hub forecasts in the September EIA outlook are not based on monthly gas prices or plant feedstock contracts.
Energy geography and producer competitiveness
Compare supplier offers through delivered economics. Gas cost is one input; conversion efficiency, utilities, maintenance, and transport can alter the result. The EIA annual forecasts do not describe a European or Asian supplier’s contract. Test energy exposure separately from ocean and inland freight, and obtain plant-specific inputs before estimating production margins.
Macroeconomic demand effects
Macroeconomic forecasts can inform a demand scenario but cannot establish product-level consumption. Keep crop economics, industrial demand, finance and currency assumptions visible and obtain current customer evidence before changing purchasing coverage.
Oil, gas and fertilizer margins
Oil affects bunker and transport exposure, while natural gas directly feeds many nitrogen and methanol plants. Their effects need separate sensitivity tests. A rise in transport cost can offset an apparent FOB saving; a change in gas cost need not pass immediately into a fertilizer offer. Use the September EIA outlook as scenario context and document the product, route and contract inputs that transmit the change into a delivered margin.
Agricultural affordability framework
Affordability should be assessed as the delivered fertilizer bill per cropped area relative to expected crop revenue, with application rates and nutrient content stated. Credit cost, local currency, timing and agronomic need influence the result. This edition does not publish an affordability index because no complete September set of comparable fertilizer, crop, currency and financing observations was assembled. Buyers can apply the framework using their own dated local evidence.
3. Nitrogen Market
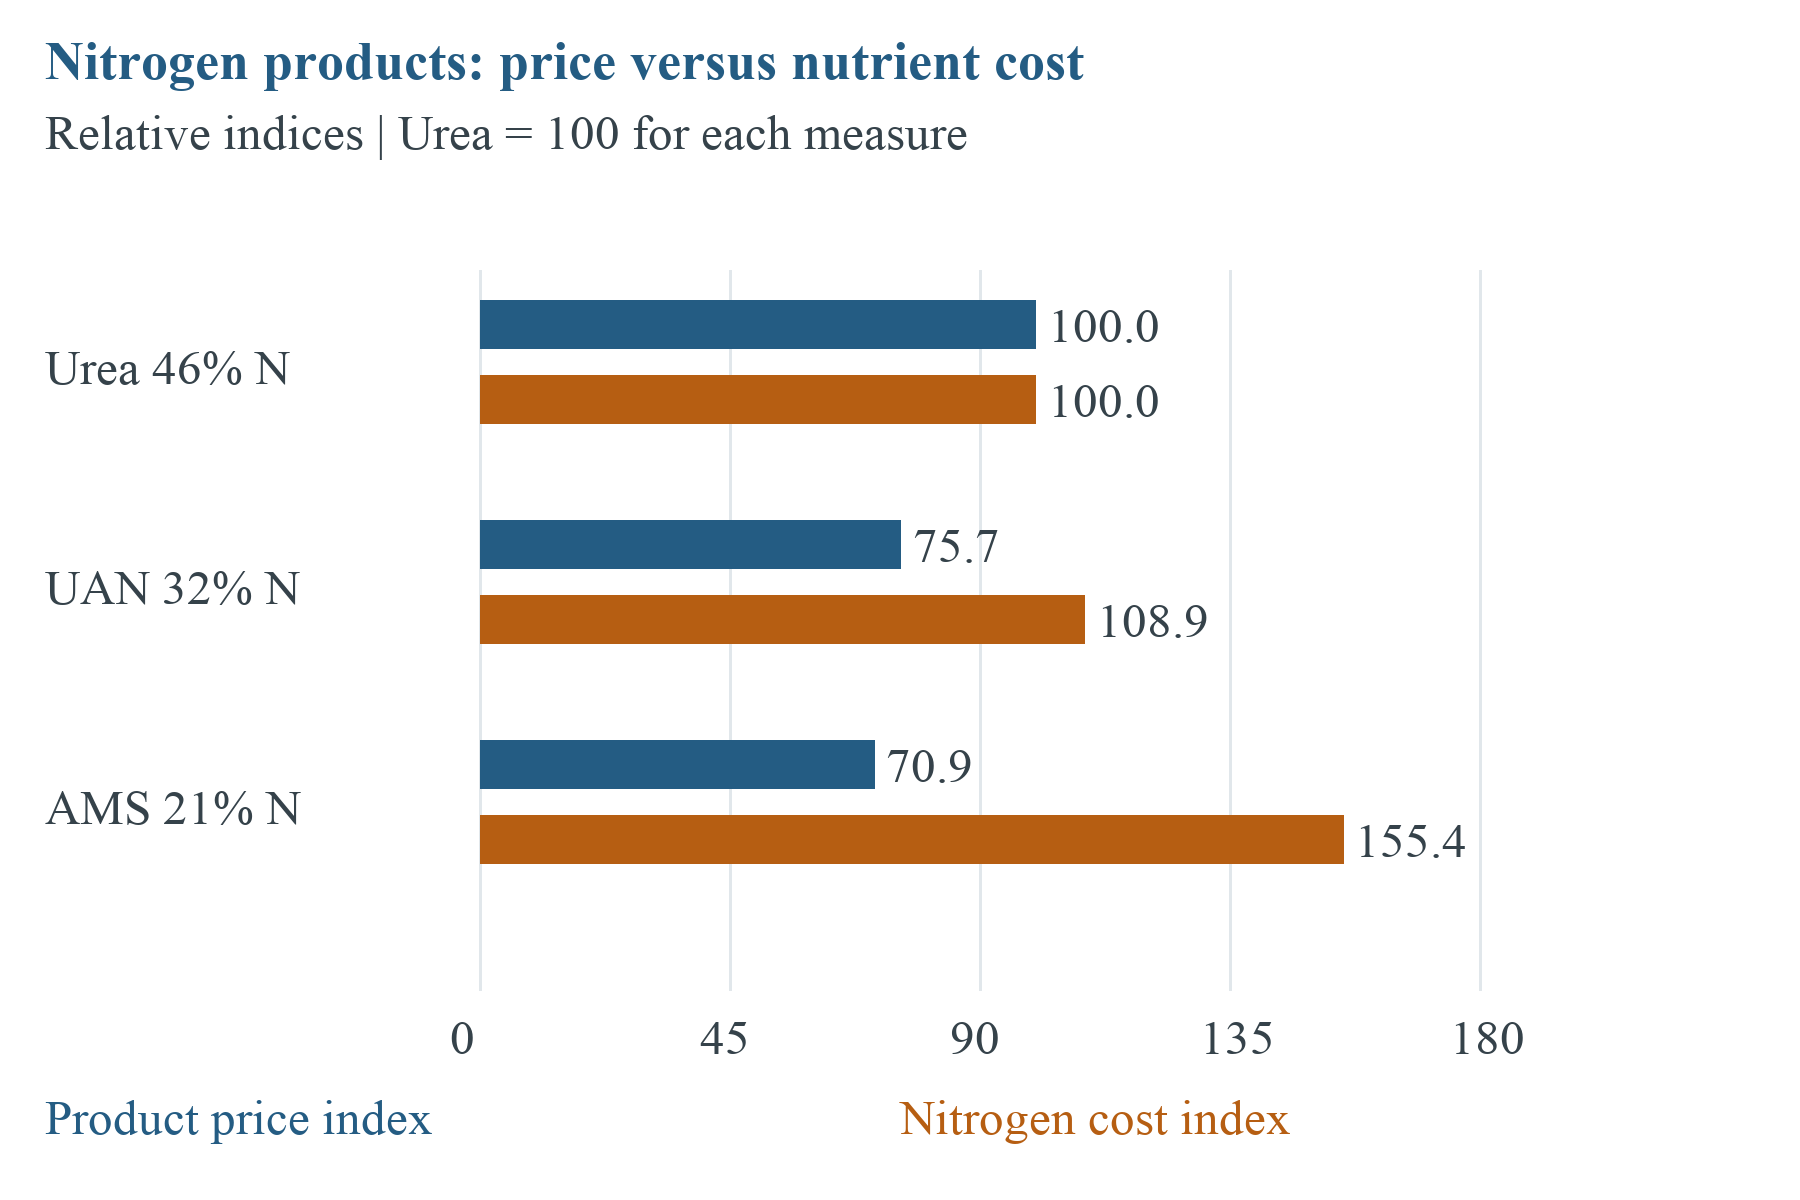
Figure 3. Relative product-price and nitrogen-cost indices, each normalized independently to urea = 100. Derived from the USDA 18 September asking averages and stated N assays; no sulfur credit. Source: USDA public price panel
Urea 46-0-0 averaged USD 1,196.67/metric ton in the selected September USDA distributor panel. Its range was USD 944.68–1,488.12/metric ton. The source reports zero change from its previous release; that does not establish flat daily trading throughout September or a global urea trend. Source: USDA 18 September report
Regional reading
The Pacific Northwest ask cannot establish a Persian Gulf, Indian, or Brazilian transaction price. Normalize granular or prilled form, grade, load port, parcel, laycan, payment, and destination cost. A difference against this US distributor observation is not automatically an arbitrage opportunity because the market, logistics, and commercial basis differ.
Quality control: No unsupported NPK-style synthetic price series is inferred from urea. Each benchmark remains tied to its stated origin, product, and delivery basis, consistent with the methodology used throughout this report series.
Urea supply and demand balance
The September evidence assembled here establishes a regional price observation and a long-term capacity commitment, not a global urea balance. India’s official procurement portal shows a tender process but, without a dated award or shipment record, this edition makes no claim about purchased volume or price impact. Protect firm requirements with qualified supply and treat unconfirmed allocation or export availability as a watchpoint.
Other nitrogen products
Industrial urea, ammonium sulfate, ammonium nitrate and UAN need product-specific quotations and handling controls. For Diesel Exhaust Fluid (DEF) – AUS 32 applications, confirm the required urea quality and applicable customer specification. Agricultural-grade pricing or certificates alone cannot establish suitability for an industrial use.
Nitrogen outlook: October–November
Independent planning recommendation: stagger discretionary coverage around confirmed customer need and supply windows. Tender announcements should prompt verification of scope, dates, and award status, not a mechanical buying response.
China, India and Brazil: the demand triangle
These markets require different decision inputs. For China, verify export availability and the offered product’s permitted documentation. For India, distinguish a tender notice from an award and from shipped volume. For Brazil, use destination-specific freight, inland delivery, crop timing, credit and currency assumptions. This edition makes no numerical September import or export claim for these countries because a comparable public monthly series was not established.
September price dispersion
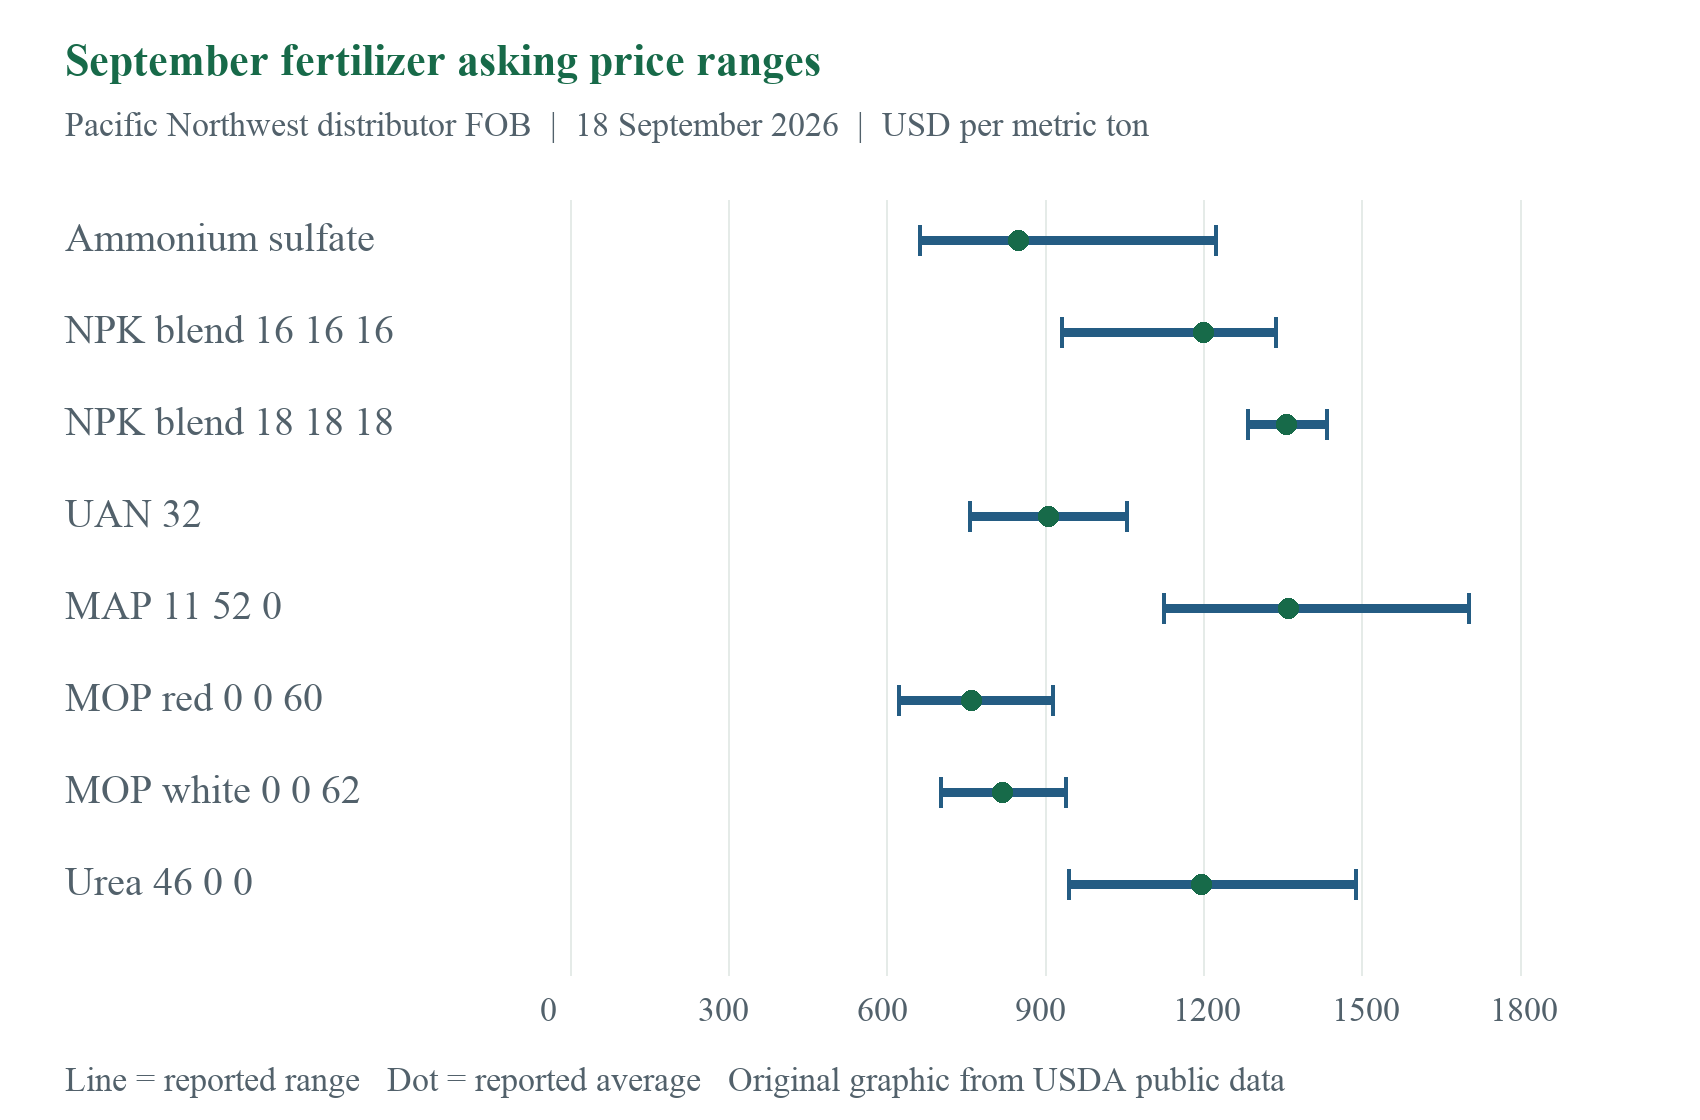
Figure 4. Low and high asking prices with reported averages. Values converted from the original USDA mass basis; the dot is the published average, not the midpoint. Source: USDA, 18 September
Nitrogen cost per nutrient unit
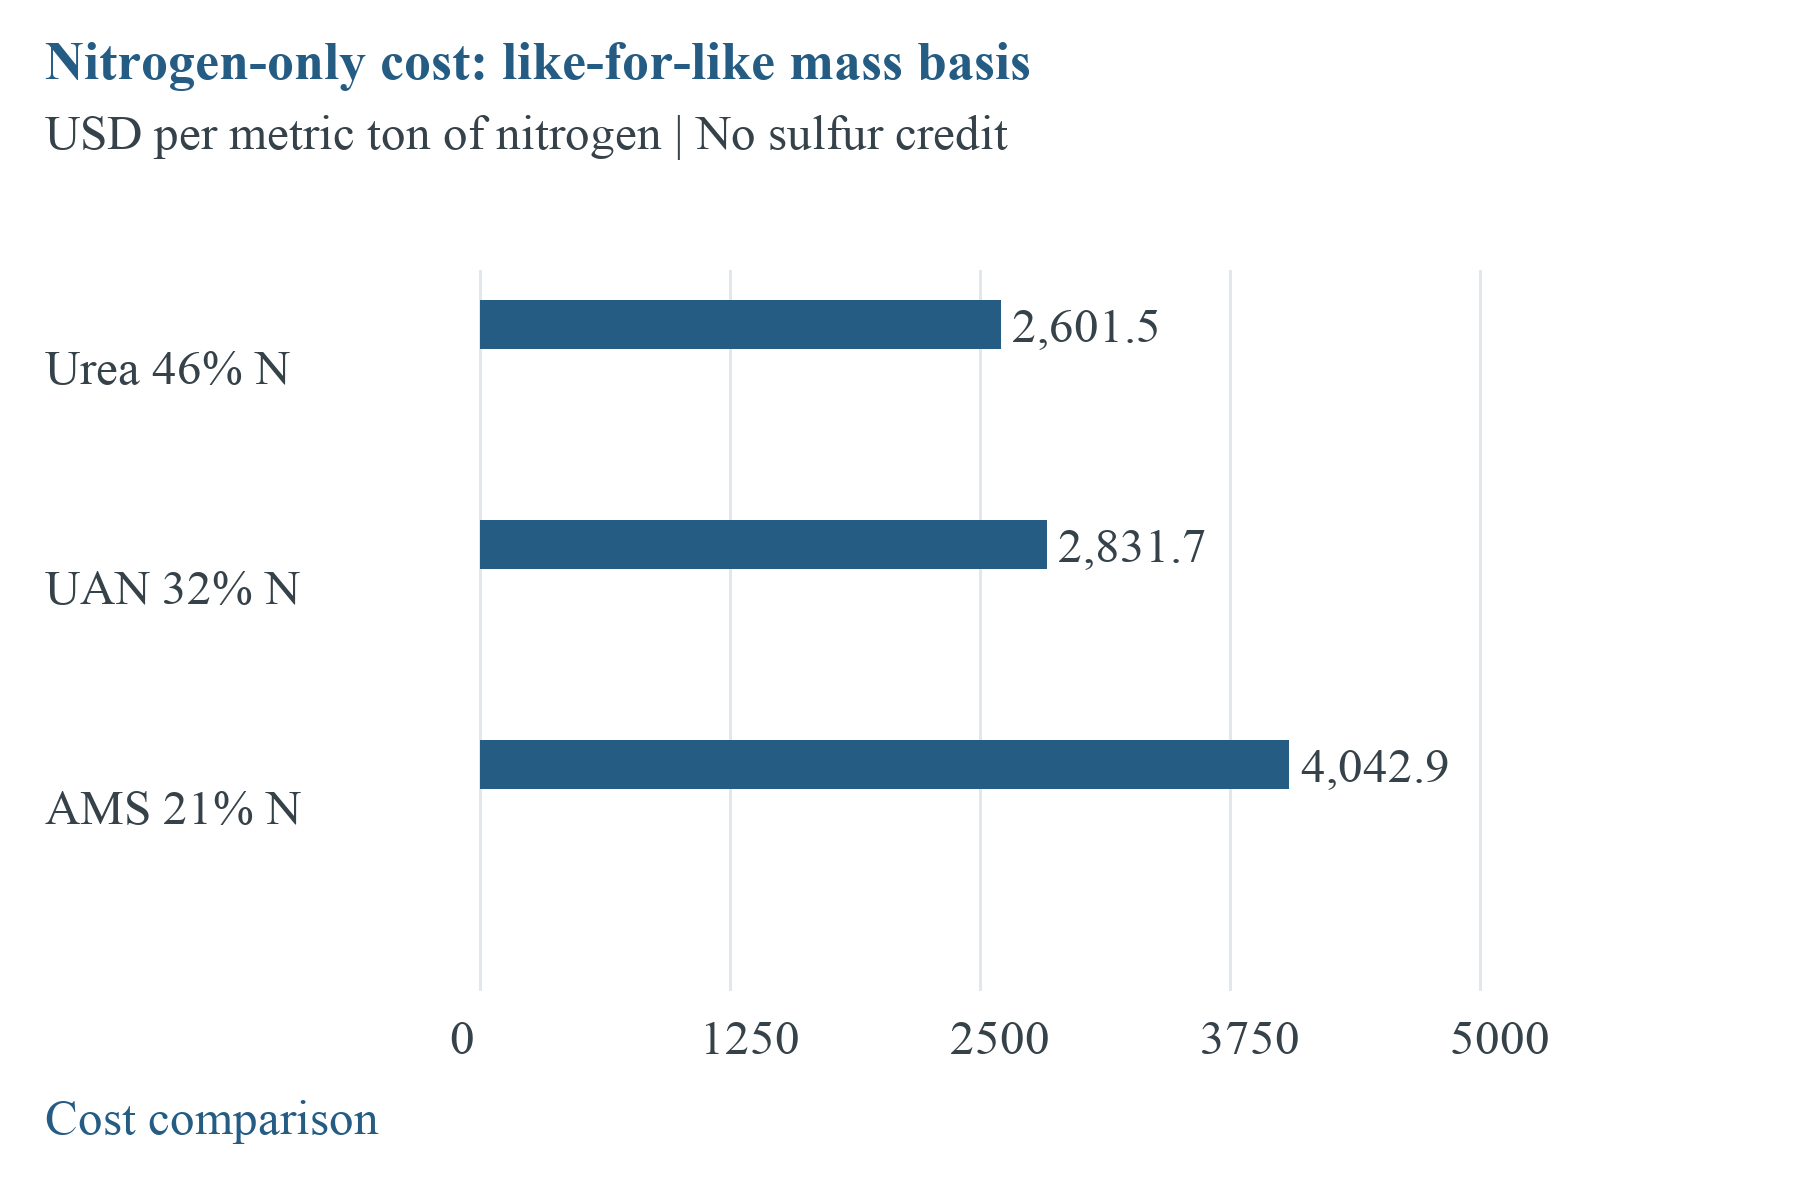
Figure 5. Nitrogen-only cost comparison on a common metric-ton nitrogen basis. Label assays are 46%, 32%, and 21%; agronomic interchangeability is not assumed. Source: USDA product prices
| Product | Low | Average | High |
|---|---|---|---|
| Ammonium sulfate | 661.39 | 849.00 | 1,223.57 |
| NPK blend 16 16 16 | 931.45 | 1,200.73 | 1,336.94 |
| NPK blend 18 18 18 | 1,283.31 | 1,358.16 | 1,433.00 |
| UAN 32 | 757.29 | 906.16 | 1,055.01 |
| MAP 11 52 0 | 1,124.36 | 1,362.09 | 1,701.97 |
| MOP red 0 0 60 | 622.81 | 760.59 | 914.92 |
| MOP white 0 0 62 | 702.17 | 820.31 | 938.43 |
| Urea 46 0 0 | 944.68 | 1,196.67 | 1,488.12 |
Table. Pacific Northwest 18 September distributor asking panel, USD per metric ton. The source’s range is a set of asking observations, not a confidence interval or transaction distribution. Source: USDA public report
Dispersion matters more than a single average when an actual offer sits near an extreme. In this panel, urea spans approximately USD 543 per metric ton and MAP approximately USD 578 per metric ton after conversion. Those gaps may reflect different quotations or commercial conditions; the report does not attribute them to a particular cause or infer the number of trades. Request a comparable specification and delivery basis before judging an offer against the range.
Divide each converted product price by its nitrogen mass fraction to obtain USD per metric ton of contained nitrogen. This arithmetic is a screening method, not a recommendation to substitute products. Ammonium sulfate also supplies sulfur; UAN is a liquid system. Agronomic availability, application, transport and handling can change the usable value. The calculation assigns no value to secondary nutrients and should not be interpreted as total fertilizer effectiveness.
European nitrates and UAN
Nitrates and urea ammonium nitrate solution require their own specifications, delivery systems and agronomic comparisons. Urea pricing alone cannot determine their value. Compare USD per metric ton of product and USD per metric ton of usable nitrogen separately, then add handling, storage and application costs. Obtain current quotations and safety requirements for each product; this report contains no inferred September nitrate or UAN price curve.
4. Ammonia Market
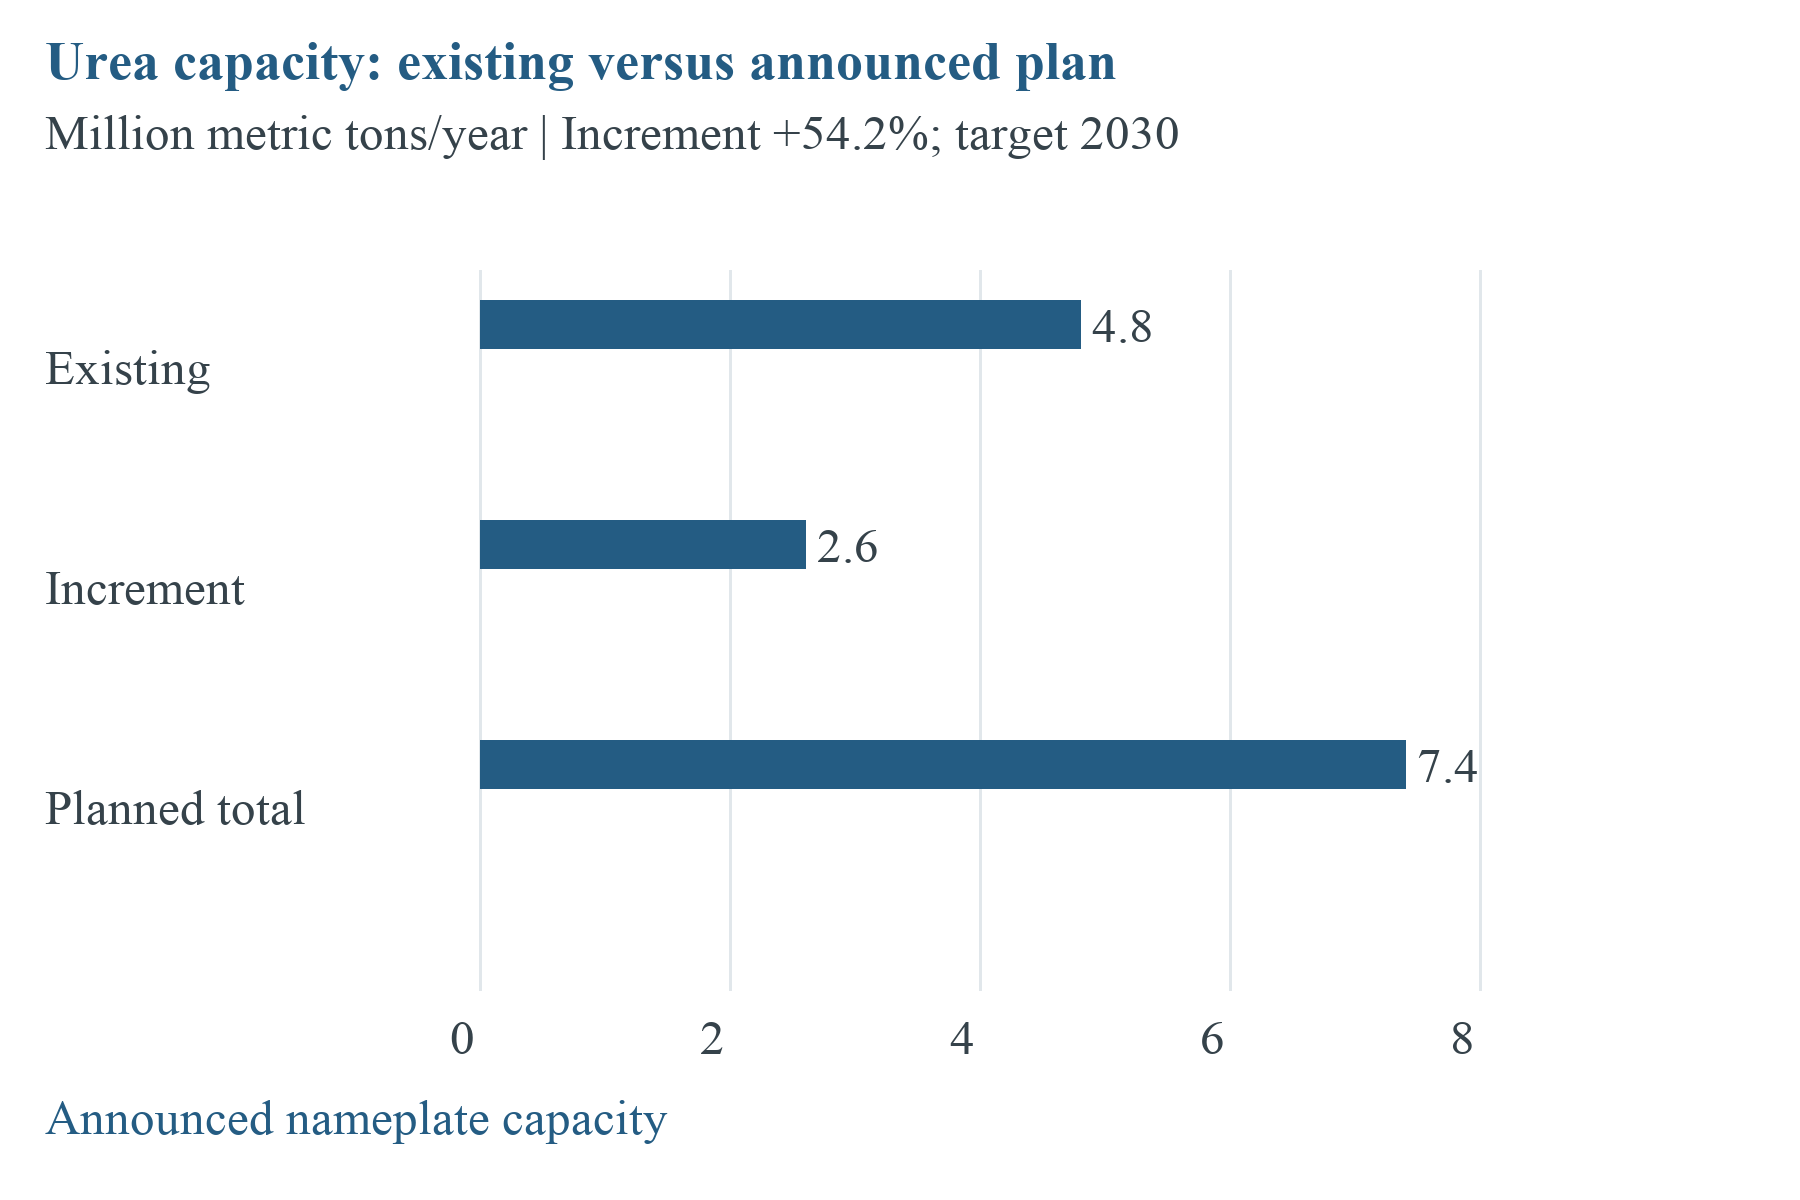
Figure 6. Existing capacity, planned increment, and planned total are compared, not plotted as a time series. Planned increment is 2.6 million metric tons/year, or 54.2%; completion target is 2030. Source: KBR capacity confirmation dated 29 September; Source: Samsung EPC confirmation dated 11 September
No reusable September regional ammonia price series is published in this edition. The SABIC project disclosure supports future nameplate capacity only. Samsung’s 11 September EPC announcement independently confirms the project’s 2030 completion horizon and integration of ammonia with urea production; neither disclosure proves September merchant ammonia availability.
Source: Samsung project announcement
Regional ammonia dynamics
Ammonia procurement depends on compatible vessels, storage and receiving facilities, and price. A supplier’s production capacity does not demonstrate export availability. Confirm the named plant, berth, vessel window, destination terminal, and maintenance status for each cargo. The SABIC investment disclosure is a dated strategic signal with a future completion target; it cannot substantiate current merchant ammonia supply.
Demand structure and production economics
Distinguish captive ammonia consumption from merchant availability. Downstream fertilizer and industrial requirements may compete for the same production, while a plant’s actual export allocation depends on contracts and operations. Verify the offered cargo rather than applying nameplate capacity to a monthly supply calculation.
Ammonia outlook: October–November
Independent planning outlook: retain staged coverage for firm downstream requirements and verify storage and carrier access early. Review the plan on confirmed changes in supplier allocation, plant status or terminal acceptance. No numerical ammonia price target is assigned.
Ammonia trade routes and contract structures
Compare ammonia offers using the same delivery point, specification, parcel, payment and allocation period. Contract settlement references and prompt cargo quotations may follow different mechanisms. Index-linked contracts need an explicit fallback if the named reference becomes unavailable, plus clear treatment of freight and quality adjustments. Require technical confirmation of terminal and carrier suitability before making a commercial commitment.
Carbon capture in the announced project
Samsung describes a post-combustion carbon-capture system that supplies carbon dioxide for urea synthesis. This is a disclosed process feature, not an independently validated lifecycle-emissions intensity, low-carbon product certificate, or evidence of a September green premium. Buyers need product-specific carbon accounting before making environmental claims. Source: Samsung process description
5. Sulfur Market
Elemental sulfur is distinct from ammonium sulfate. The September USDA ammonium-sulfate observation provides a nitrogen-and-sulfur fertilizer reference, but cannot be converted into an elemental-sulfur spot quotation. This section uses an independent cost-chain framework and publishes no unlicensed sulfur assessment.
Supply structure
Sulfur purchasing requires a bridge from the producing source through form, handling and delivery to the downstream plant. Granular, formed, lump and molten sulfur cannot be treated as interchangeable cargoes. Availability depends on the offered form, storage and loading system. Because this edition has no verified open September sulfur balance, we evaluate supply adequacy through supplier confirmations and operating requirements rather than a claimed global surplus or deficit.
Demand centers and downstream economics
Determine sulfur requirements from confirmed downstream production and usable inventories. Changes in acid and fertilizer output affect replenishment needs, but do not follow from an isolated price report. Include freight, handling, quality, and working capital when evaluating an additional cargo.
Sulfur outlook: October–November
Independent planning outlook: secure critical replenishment against the downstream operating plan and retain a technically qualified alternative. Increase cover only when the interruption risk justifies the financing and storage cost. Exact sulfur prices and global inventory forecasts are outside the verified public evidence assembled for this edition.
Persian Gulf producer system
Persian Gulf sourcing plant by plant and route by route. Confirm the nominated load port, physical form, cargo readiness, vessel approval, banking chain and insurance conditions. A low headline price has little value if the shipment cannot be financed, insured or received on the required date. No private port line-up, inventory figure or sulfur export estimate is reproduced in this report.
China, Morocco and downstream operating rates
Downstream sulfur requirements depend on acid production, phosphate operations and other industrial users. To turn a market signal into a purchasing decision, confirm the buyer’s operating plan, inventory and replenishment lead time. Public corporate disclosures can establish reported capacity or results, but they cannot establish a plant’s current operating rate unless they state it explicitly. This edition publishes no September operating-rate estimate for China or Morocco.
Sulfur inventory policy
Set sulfur coverage around the consequence of a downstream interruption, usable storage, cargo lead time, and reliability. Separate physically available stock from booked or in-transit material. Monitor form, moisture, contamination, and safe handling as part of availability. Management should approve coverage bands and test them against delayed arrival and quality rejection; a universal number of stock days would be inappropriate without plant data.
Sulfur exposure through the phosphate chain
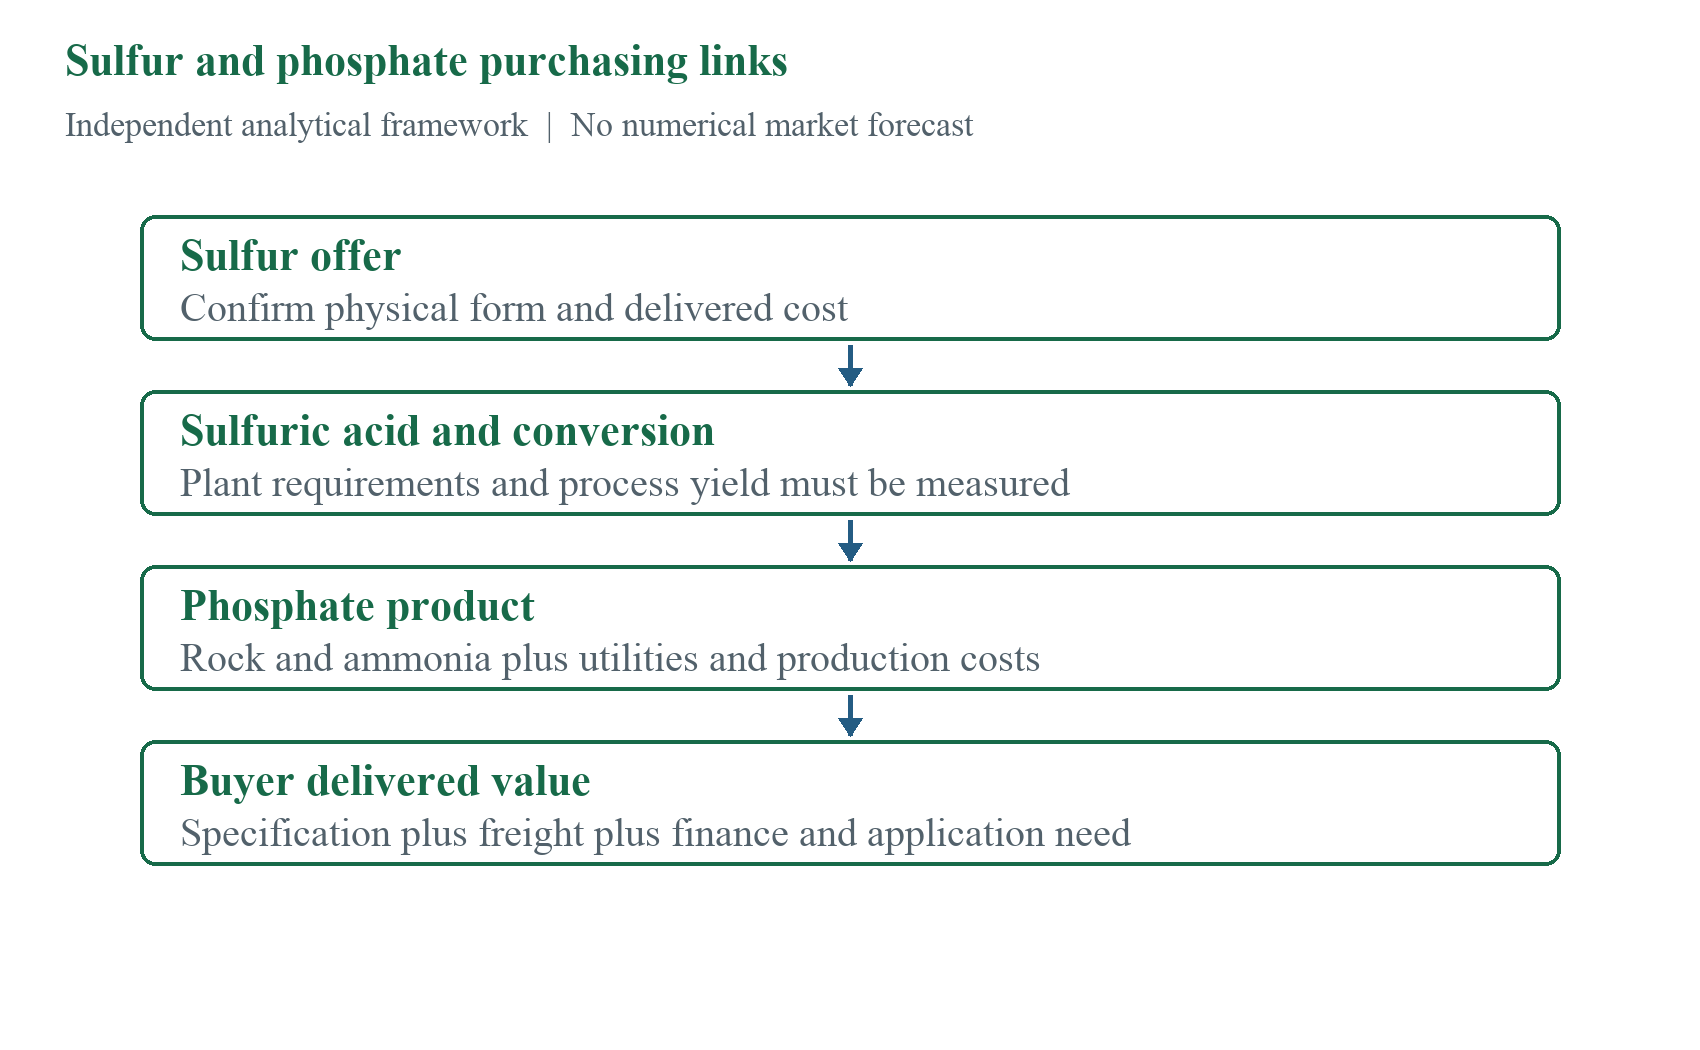
Figure 7. Independent phosphate cost-chain diagram. No numerical sulfur quotation, production yield, or September plant margin is implied.
The commercial model should use the buyer’s actual sulfur requirement and process yield. A price for ammonium sulfate cannot be substituted for elemental sulfur, and a fertilizer distributor quote cannot establish an acid producer’s raw-material cost. Keep the feedstock record separate from the finished-product observation so that a change in one input does not become an unsupported claim about another market.
6. Phosphates Market
| Driver | Dated evidence | Commercial interpretation |
|---|---|---|
| Energy | EIA 9 September | Annual forecasts for scenario planning |
| Capacity | KBR 29 September; Samsung 11 September | Future project, not monthly balance |
| Distributor prices | USDA Pacific Northwest 18 September | Regional asks; no seaborne extrapolation |
| Methanol | September validity and October reset | Posted references, not realized prices |
| India procurement | NFL DAP tender 14 September | Procurement notice, not physical award |
Commercial interpretation
MAP 11-52-0 averaged USD 1,362.09/metric ton in the Pacific Northwest distributor panel on 18 September. Its asking range was USD 1,124.36–1,701.97/metric ton. This is neither a Brazil CFR assessment nor a phosphoric-acid price. Requires a separate dated offer for DAP, rock, or acid rather than deriving one from MAP. Source: USDA September MAP observation
DAP, MAP, and phosphoric acid
DAP, MAP, and phosphoric acid represent different products and nutrient systems. Compare concentration, impurities, moisture, physical form, and intended application before evaluating cost per usable nutrient. Acid purchasing also requires compatible transport and storage. Do not derive a MAP or acid quotation by applying a fixed spread to the DAP reference; the appropriate commercial inputs must come from a dated quotation or a directly applicable public series.
Regional market structure
Phosphate offers vary across origin, nutrient grade, form, and destination. Compare the complete delivered value and confirm policy eligibility where relevant. The same benchmark can yield different commercial results because freight, credit, and inland delivery vary.
Phosphate outlook: October–November
Commercial response: track sulfur cost and freight alongside the finished phosphate benchmark rather than relying on the finished-product price alone, and monitor domestic subsidy programs (India in particular) as a determinant of regional demand independent of the seaborne price.
Phosphate rock and producer integration
Integration can change exposure to rock, acid, ammonia, sulfur, and conversion cost, but it does not establish a producer’s current margin. Compare purchasing alternatives through the full cost chain. Use public company statements only for the performance, capacity, or investment they disclose. Destination allocation and prompt availability remain commercial questions that need confirmation, not assumptions about an integrated supplier’s advantage.
India and subsidy economics
Enter any subsidy, import restriction, or procurement rule into the model only after identifying the issuing authority, effective date, eligible product, and beneficiaries. A proposal has a different status from an implemented measure. The official tender evidence cited here supports procurement activity; it does not establish a new September subsidy rate. Maintain a policy register and obtain the controlling notice before adjusting a bid or margin calculation.
Brazil and MAP purchasing
Evaluate MAP offers through the receiving port, inland movement, storage, application window, and customer credit. Currency and finance assumptions should be dated and kept separate from the USD supplier quotation. Split shipment windows where delivery risk justifies it, while considering parcel economics and handling costs. This edition makes no unverified September Brazilian MAP quotation, port-priority policy or import-volume claim.
7. Potash Market
| Potash grade | 18 September average | Status |
|---|---|---|
| Red MOP 0-0-60 | USD 760.59/metric ton | Distributor FOB ask |
| White MOP 0-0-62 | USD 820.31/metric ton | Distributor FOB ask |
| Reported change | Zero for both grades | Versus previous release only |
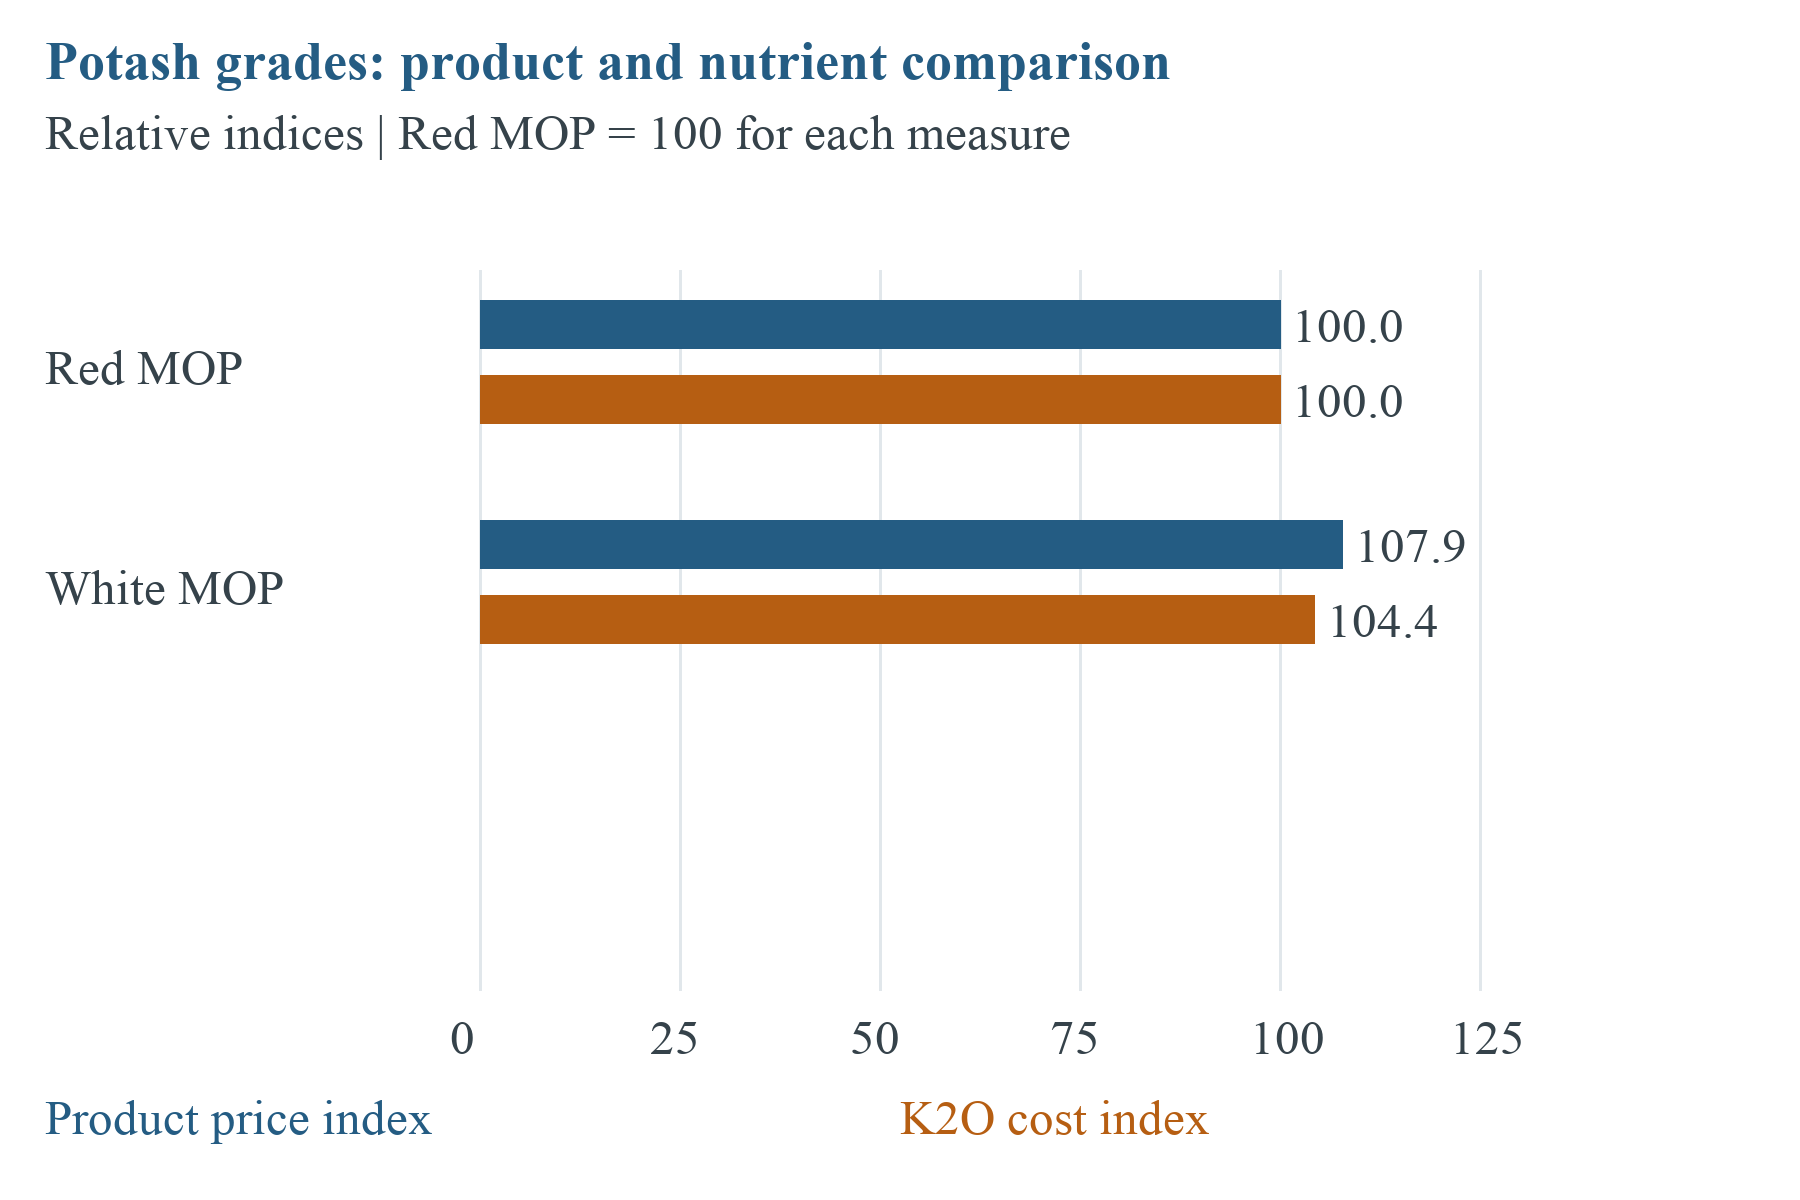
Figure 8. Product-price and K2O-cost indices, each independently normalized to red MOP = 100. White MOP has a higher product price and a smaller nutrient-normalized premium. Source: USDA 18 September price panel
Red MOP 0-0-60 averaged USD 760.59/metric ton, while white MOP 0-0-62 averaged USD 820.31/metric ton in the same September regional panel. A direct product-price comparison does not isolate the value of grade, purity, form, or specification. Source: USDA red and white MOP
Both potash rows show zero reported change versus the previous release. The observation supports stability in this specific asking panel only. It does not demonstrate unchanged Canadian mine netbacks, Indian contract prices, Brazilian delivered offers, or world demand.
Potash comparison rule: red 0-0-60 and white 0-0-62 distributors ask for different product specifications. They are not a single global MOP benchmark.
Supply concentration and trade flows
Independent procurement framework: map each offered potash cargo to the producing plant, mine or processing route, rail or inland leg, export terminal and receiving destination. This identifies concentrated execution exposures without asserting an unverified September world supply share or country balance.
A rail, terminal, vessel or inland constraint can affect delivered cost even where material is available at origin. Treat a route constraint as confirmed only when carrier, terminal or other relevant evidence establishes its timing and cargo impact.
Demand centers and agronomic resilience
Independent procurement framework: product choice should follow a documented agronomic requirement and a qualified specification. Local evidence is needed on soil reserves, crop requirements, and application timing. This report does not infer a September demand rebound or replenishment cycle from the selected price panel.
We did not quantify country-level potash demand and trade volumes because we could not establish a comparable September public dataset. Do not count import-support service tenders as purchases of potash or urea.
MOP, SOP and affordability
Independent procurement framework: MOP and SOP have different specifications. Obtain agronomic and technical approval before substitution, and compare delivered cost for the approved product. No September SOP premium is inferred from the MOP observations.
Potash does not depend on natural gas, ammonia, or sulfur as major feedstocks in the same way nitrogen and phosphate production do. Nevertheless, mine economics, royalties, rail, terminal, and ocean costs remain material. Public producer guidance is a useful context, but farm affordability must be evaluated in local currency against crop revenue and financing cost.
Potash outlook: October–November
Independent base scenario: qualified supply remains available for confirmed customer requirements, but grade and delivered terms differ. Stagger discretionary coverage and verify rail, terminal, and vessel access before assuming a cargo can arrive on time. This is a planning assumption, not a September global balance finding.
- Bull risks: stronger Brazilian or Southeast Asian demand, Canadian logistics constraints, or renewed sanctions-related disruptions to Russian and Belarusian volumes.
- Bearish risk: delayed grower buying, weaker crop prices, or rising Russian and Belarusian availability pressuring offshore netbacks.
- Commercial response: maintain normal coverage, track producer guidance updates each quarter, and use licensed spot benchmarks for price-sensitive negotiations rather than the directional data presented here.
Canada and Canpotex logistics
Independent logistics framework: confirm the actual export terminal, rail or inland leg, and vessel window for any Canadian offer. Nameplate production and supplier guidance cannot guarantee prompt cargo. Use a written allocation and loading confirmation before counting supply as available.
Independent logistics framework: assess rail, terminal, weather, and labor disruption as possible cargo-specific scenarios. This edition does not establish that any named Canadian constraint occurred during September. Obtain current carrier and terminal evidence before changing coverage.
The report excludes older annual company guidance from its September numerical comparison. For current buying, confirm contract commitments, maintenance, terminal acceptance, and destination allocation directly; annual capacity cannot substitute for a nominated cargo.
Russia, Belarus, and sanctions complexity
Independent compliance framework: evaluate any Russian or Belarusian offer through the actual counterparties, ownership, banks, insurers, vessel, and route. This edition makes no claim about September shipment continuity or sanctions status. Qualified counsel and the relevant service providers must determine transaction acceptability.
Evaluate discounted FOB offers from these origins based on payment risk, delay probability, and resale limitations. A cargo that cannot be financed or insured through the buyer’s counterparties is not equivalent to unrestricted supply, regardless of the headline discount.
Qualified legal and sanctions professionals must make compliance decisions. Market analysis like this report can identify exposure but cannot replace transaction-specific legal review.
Contract benchmarks and spot transparency
China and India often use major contract negotiations to establish reference points for Asian potash trade. Contract prices, producer averages, and spot transactions differ in timing, grade, and delivery basis. They should never be combined without an explicit basis bridge.
Producer netbacks also vary by freight and product grade. Standard MOP, granular MOP, and SOP serve different markets. A published quarterly average or forward guidance range can guide sentiment, but it does not create a complete weekly curve for Vancouver FOB, Brazil CFR, or Southeast Asia CFR.
8. NPK and Compound Fertilizers
The public USDA September panel includes two NPK blends, 16-16-16 and 18-18-18. These are explicitly labeled blends on a Pacific Northwest distributor-asking basis, not global compound-fertilizer assessments. Their formula-specific observations permit a limited comparison without creating a synthetic NPK spot series.
| Input | September public observation | NPK use |
|---|---|---|
| Urea 46-0-0 | USD 1,196.67/metric ton | Regional ask, not plant feedstock contract |
| MAP 11-52-0 | USD 1,362.09/metric ton | Specification and nutrient assay required |
| Red MOP 0-0-60 | USD 760.59/metric ton | Regional ask, grade dependent |
| Conversion and logistics | No universal published input | Use documented facility and cargo costs |
Recommended buying approach: compare formulations on delivered nutrient cost, use staggered coverage, and verify whether quoted grades are chemically equivalent before making cross-market comparisons.
Formulation economics
An NPK grade is not a single commodity. The cost of a 15-15-15, 20-20-0, or crop-specific formulation depends on nutrient concentration, raw material selection, granulation route, fillers, additives, packaging, and plant scale. Two products carrying the same headline grade can have different physical quality, nutrient solubility, trace-element content, and delivered performance.
Regional demand and procurement
Buyers should calculate the cost per unit of available nutrient rather than compare only USD per metric ton across grades. They should also evaluate nutrient balance for the target crop and soil. A lower-priced grade can be more expensive in practice if it supplies unwanted nutrients or requires additional application passes and logistics.
NPK outlook and risk controls
- Use raw-material escalation clauses only when the underlying indices and formulas are transparent.
- Before comparing offers, verify grade, nutrient solubility, granule strength, moisture content, packaging, and tolerance.
- Stagger purchases when raw materials are volatile, and secure critical seasonal volumes early enough to protect delivery.
- Do not publish synthetic market prices without a verified benchmark series for the exact grade and basis.
Production routes and quality variables
Compound fertilizers can be produced through chemical granulation, steam granulation, bulk blending, or other processes. Chemical granulation can improve nutrient distribution within each granule, while bulk blends rely on compatible particle size and density to reduce segregation. The correct choice depends on crop, distribution system, application equipment, and price.
Quality specifications should address total and available nutrients, moisture, particle-size distribution, crushing strength, caking, dust, chloride, micronutrients, and packaging. Storage climate and voyage duration can materially affect condition on arrival. A low headline price does not compensate for segregation, caking, or nutrient non-conformance discovered at discharge.
Independent inspection recommendation: agree certificates, representative sampling, loading supervision, and discharge-claim procedures for each new supplier or long voyage. Any tariff, subsidy or other policy input must be supported by a dated controlling notice before entering the commercial model.
Blender margin and working capital
Multiple ingredients increase working capital volume and timing complexity. Balance parcel economics against usable storage, confirmed formulation demand and funding cost. Excess stock of one nutrient can constrain purchase of another; no September policy change is assumed here.
A formulation margin model should track nutrient cost, conversion, packaging, loss, finance, freight and sales price by grade. Update it only when a cited public policy change is confirmed, or an executable commercial input changes; generic percentage assumptions are insufficient for final decisions.
September NPK blend comparison
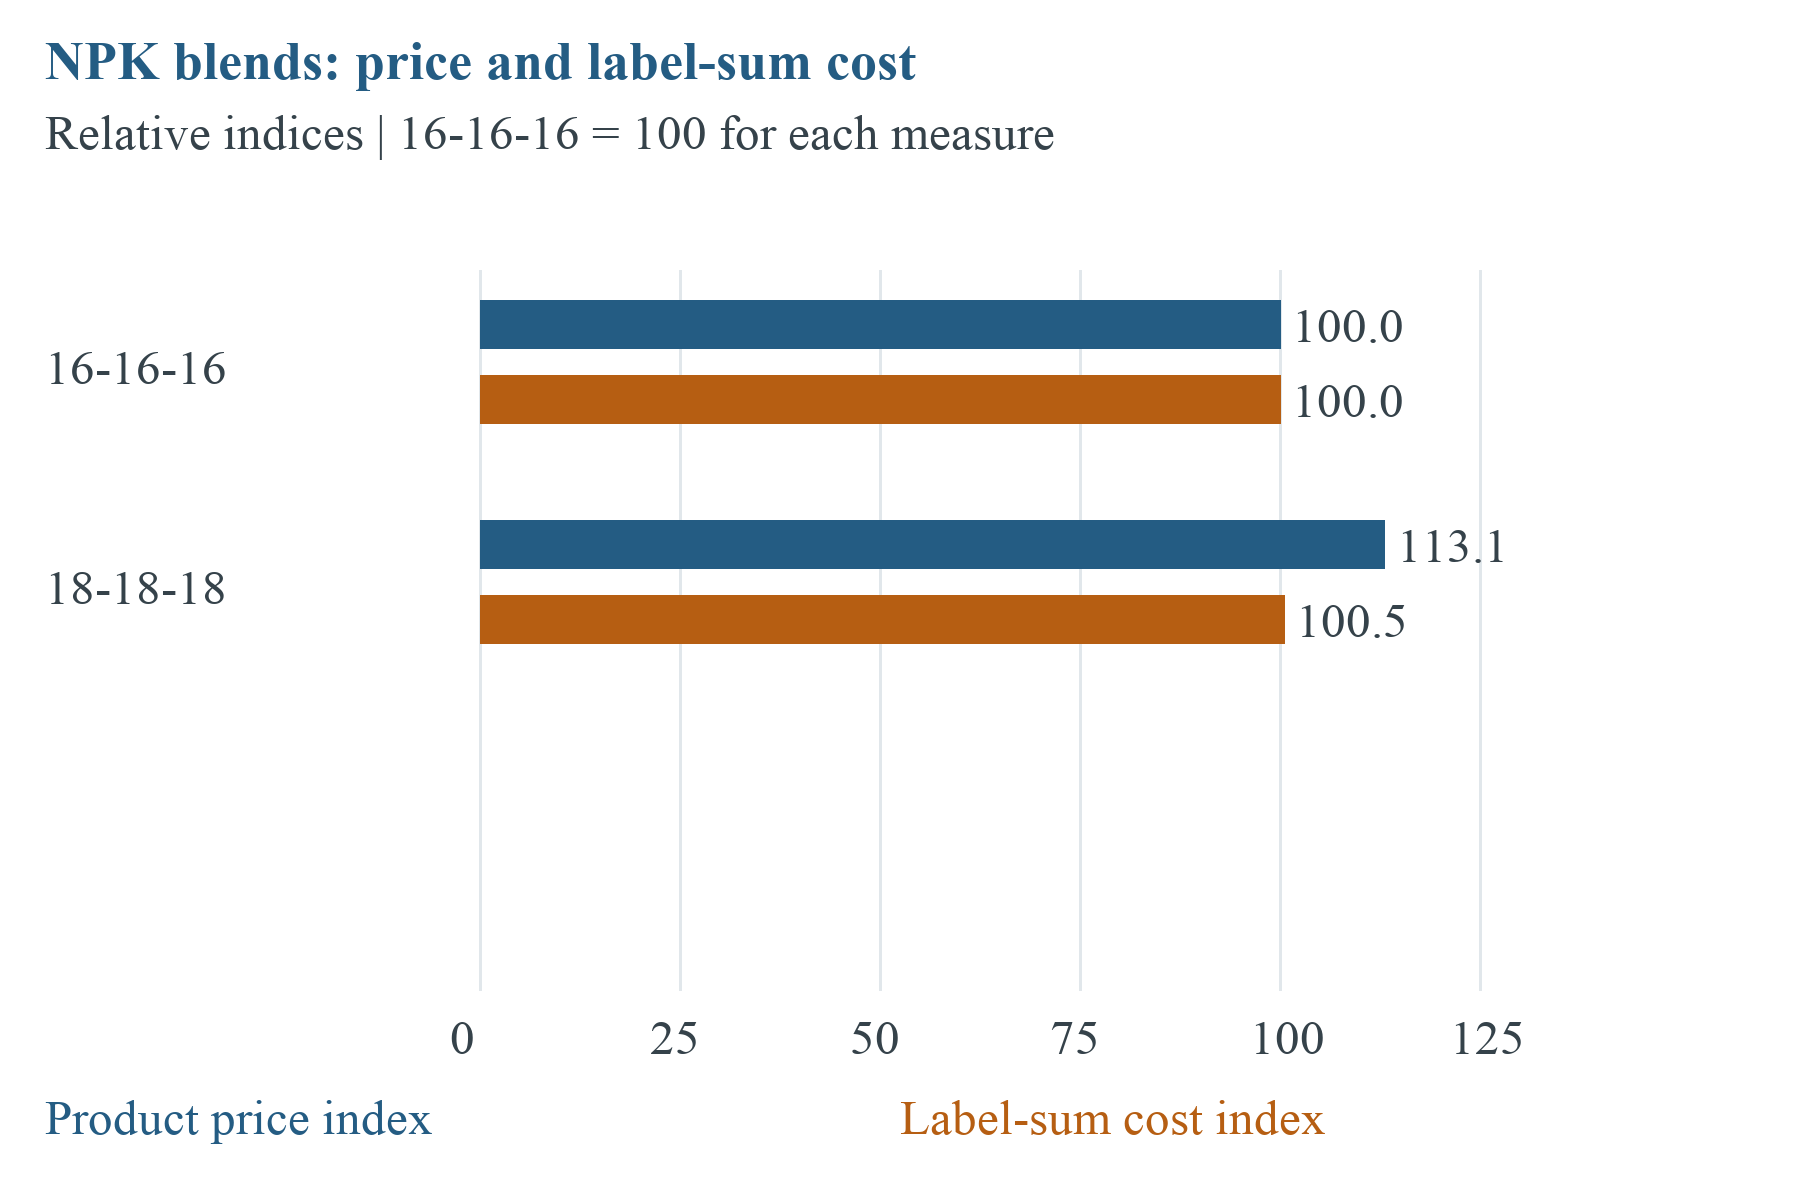
Figure 9. Product-price and conventional label-sum cost indices, each normalized to 16-16-16 = 100. The 18-18-18 product premium is much larger than its label-sum cost premium. Nutrients are not interchangeable. Source: USDA blend observations
| Blend | Average USD/metric ton | Label sum | USD/metric ton of label sum |
|---|---|---|---|
| NPK blend 16 16 16 | 1,200.73 | 48% | 2,501.51 |
| NPK blend 18 18 18 | 1,358.16 | 54% | 2,515.11 |
The 18-18-18 blend has a higher product price and a slightly higher cost per summed label unit in this panel. This does not establish agronomic superiority: nutrient ratios, solubility, physical form, application, and the required recipe still need technical review. No chemical-compound price is inferred from a blend price.
Source: USDA dated blend price panel
9. Methanol and Petrochemical Feedstocks
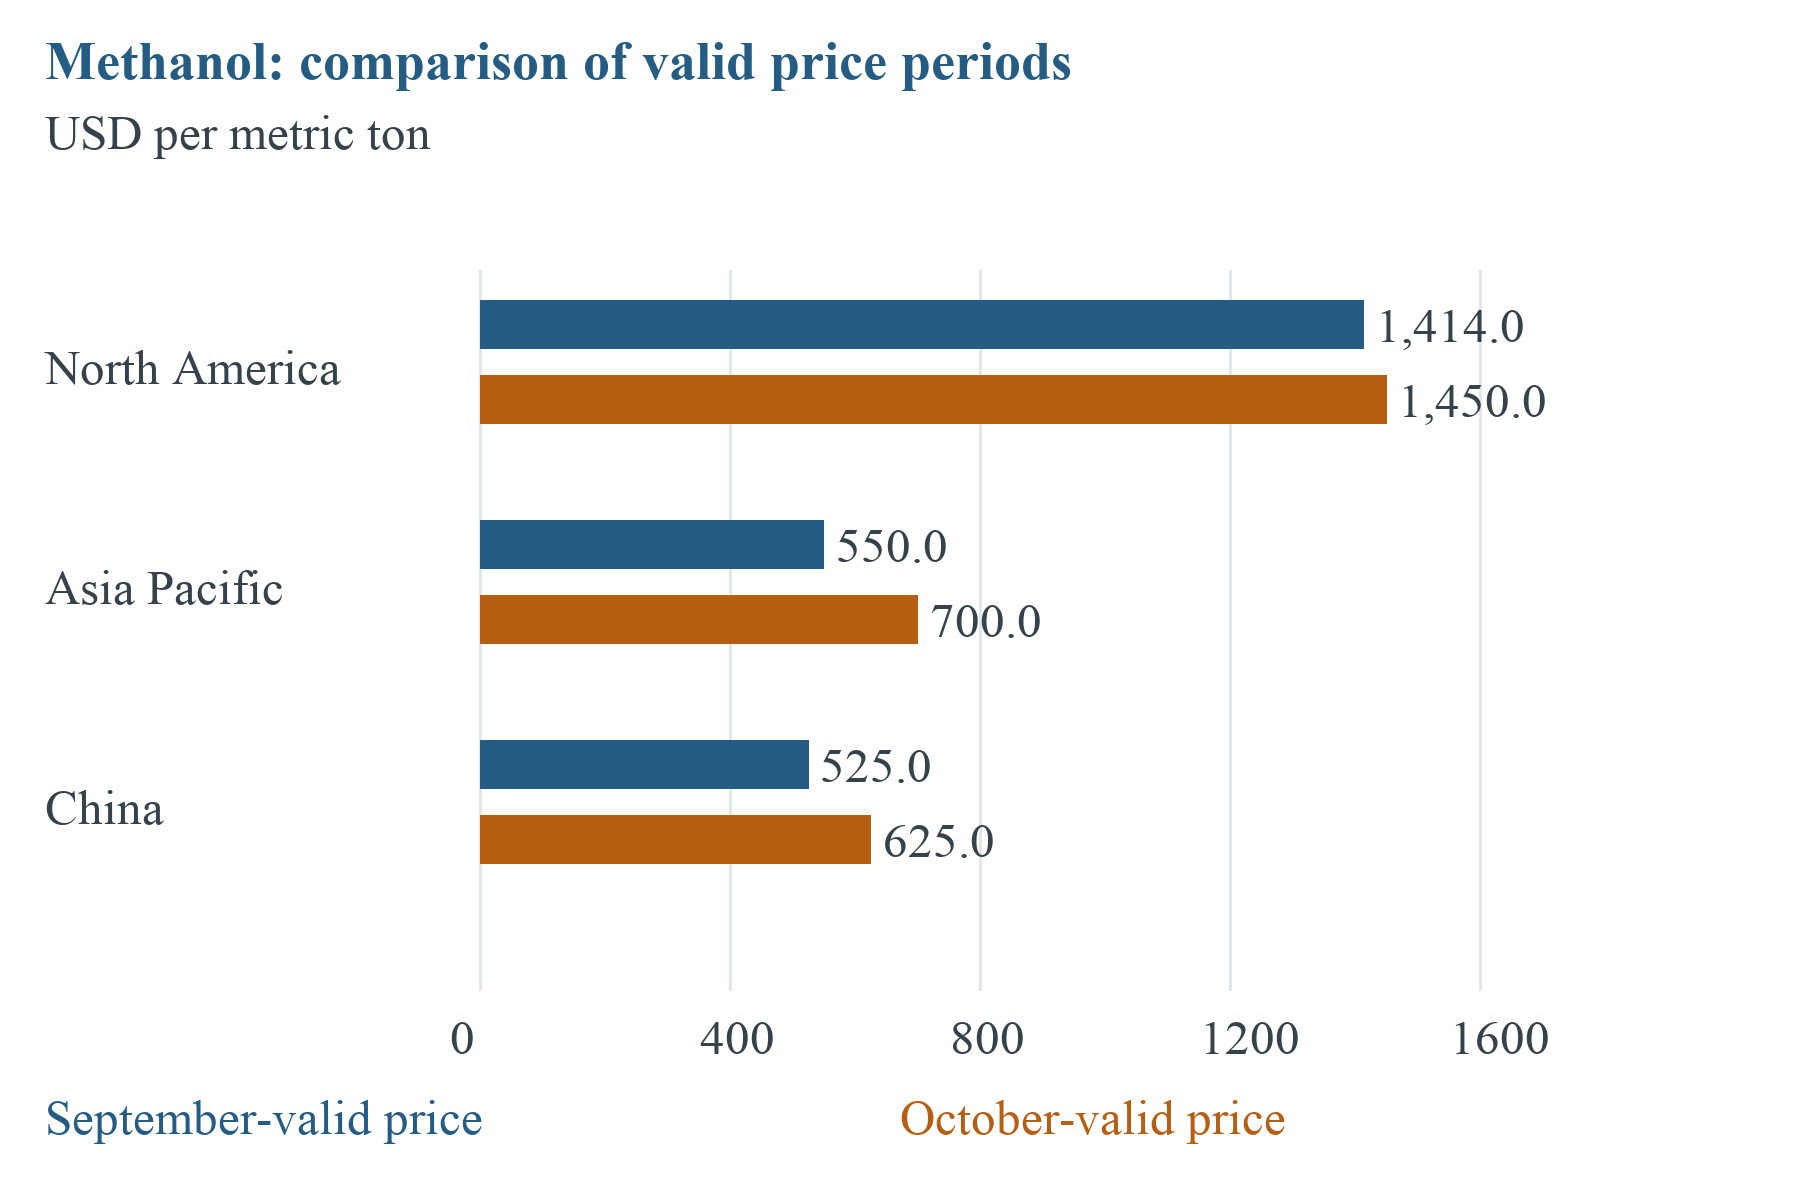
Figure 10. September-valid posted prices versus October-valid references announced during September. Absolute price comparisons use USD/metric ton; these are different validity periods, not daily spot observations.
Source: September-valid original price sheet; October posting and announcement dates
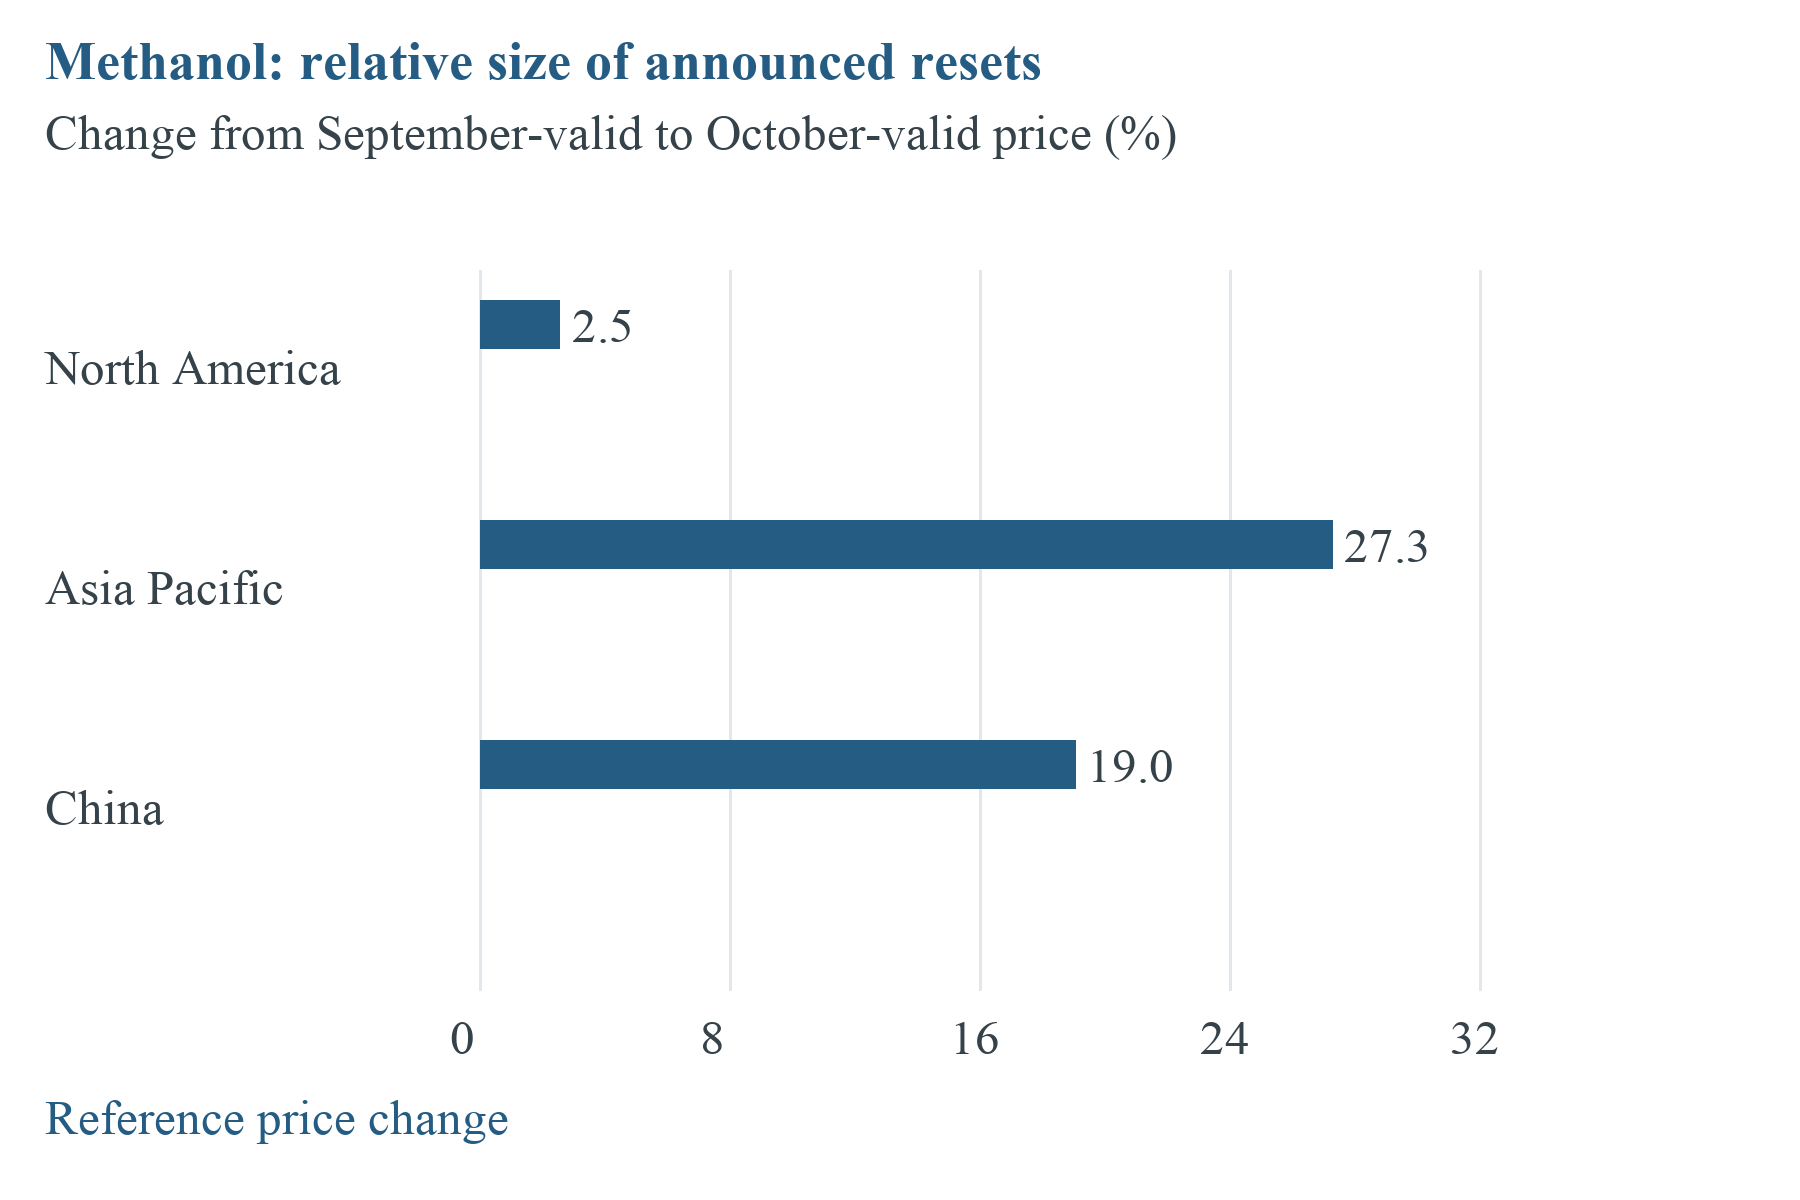
Figure 10a. Relative changes in posted references: North America +2.5%, Asia Pacific +27.3%, China +19.0%. These are October resets announced in September, not realized September trade returns. Methanex public postings
| Region | September valid | October valid |
|---|---|---|
| North America | USD 1,414/metric ton | USD 1,450/metric ton |
| Asia Pacific | USD 550/metric ton | USD 700/metric ton |
| China | USD 525/metric ton | USD 625/metric ton |
Interpreting posted methanol prices
Methanex’s original sheet gives September-valid North American, Asia Pacific and China references of USD 1,414, 550, and 525 per metric ton, respectively. Posted systems and regional bases differ; their separation does not indicate an executable arbitrage or explain why. The company’s October postings, announced in September, provide a distinct forward reference. Source: Original September-valid Methanex sheet
Feedstocks and downstream demand
Downstream demand includes formaldehyde, acetic acid, MTBE, fuel applications, solvents, and methanol-to-olefins conversion. Changes in construction, automotive activity, gasoline blending, and Chinese olefins economics can therefore affect methanol demand independently of fertilizer-market conditions. This report includes the product as a feedstock and energy-linked comparator rather than as a fertilizer in its own right.
Near-term methanol watchpoints
- Chinese coal economics and methanol-to-olefins operating rates.
- Natural-gas availability and outages at major export plants.
- Currency conversion for European contracts; no USD comparison should be made without an explicit dated FX rate.
Regional production economics
Methanol competitiveness depends on feedstock, plant performance, and delivered logistics. The September-valid posted references and October-valid reset are separate observations. Neither is a realized price or producer margin. Europe is excluded from the USD comparison because its posting is denominated in euros and we did not assemble a dated currency-conversion basis.
Methanol commercial risk
Any European contract conversion should retain its original currency, conversion date, and agreed rate in the internal record. This publication compares only Methanex’s USD-denominated regional references and publishes no converted European value.
For internal reporting, show posted price, estimated discount, freight, duty, storage, and financing separately. This creates a traceable bridge from the public Methanex reference to an expected landed or realized value for any specific cargo or contract.
Methanol reset arithmetic
| Region | Change USD/metric ton | Change percent | Validity distinction |
|---|---|---|---|
| North America | +36 | +2.5% | September reference to October reference |
| Asia Pacific | +150 | +27.3% | September reference to October reference |
| China | +100 | +19.0% | September reference to October reference |
Changes are calculated from the published metric-ton postings, without an intermediate volume conversion. North America is a non-discounted reference; Asia Pacific and China are posted contract references. A positive reset does not prove that all September transactions rose or that a posted price was realized.
Source: September sheet; Source: October postings
10. Freight and Logistics
This section excludes private broker freight sheets, vessel line-ups and subscription route assessments. Its recommendations are transaction-specific frameworks. No numerical September route premium, waterway constraint or corridor closure is claimed without a dated authority record.
| Logistics input | Public evidence | Use |
|---|---|---|
| NFL DAP import tender | 14 September government listing | Tender scope, not awarded volume |
| Freight and routing | No numerical assessment published | Actual vessel, parcel, route and laycan |
| Insurance and payment | No blanket acceptance implied | Written cargo-specific confirmation |
Landed-cost discipline
Landed cost combines the supplier basis with freight, insurance, handling, inland delivery, financing and expected physical loss. Obtain each component for the actual cargo and destination. A public fertilizer observation does not supply the missing transport cost.
Red Sea, Black Sea and alternative routing
Routing decisions need current vessel, insurer, bank, and port acceptance. Compare the named route and a feasible alternative using transit time, freight, insurance, inventory carry, and destination readiness. Do not infer a current closure, restriction, or premium from an older announcement. Escalate a change in legal or operational acceptability before fixture and keep the decision’s evidence and date in the cargo record.
Freight contracting priorities
Match parcel size and vessel class to the terminal’s capabilities and expected route. For Americas-bound movements, compare named route alternatives, transit time, slot availability, and total delivered cost using current carrier or authority information.
Maintain an alternative logistics plan for critical seasonal cargoes, including non-Persian Gulf origins and non-Rhine-dependent inland routing where feasible.
Vessel classes and product compatibility
Urea, sulfur, phosphates, potash and NPK generally move in dry-bulk vessels, while gas carriers transport ammonia and chemical tankers transport methanol. Freight comparisons must remain within compatible vessel and cargo systems. September offers should be normalized for parcel size, stowage, contamination risk, terminal capability, insurance, laycan and demurrage.
Vessel size trades unit transport cost against parcel, draft, storage and discharge constraints. Splitting a cargo may improve flexibility but can raise costs and complicate inspection or laytime. Test these alternatives using dated executable freight offers, not an assumed September route premium.
Insurance, finance and documentation
Confirm cover, exclusions, deductibles, payment-route acceptance and required documents before award. Letters of credit and documentary collection can create timing risk when vessel or origin details change. Obtain written acceptance of the actual counterparties and route where required. Pricing comparisons should include financing and insurance terms; otherwise, a nominally cheaper cargo may require more cash or carry higher execution risk.
Delivered cost comparison
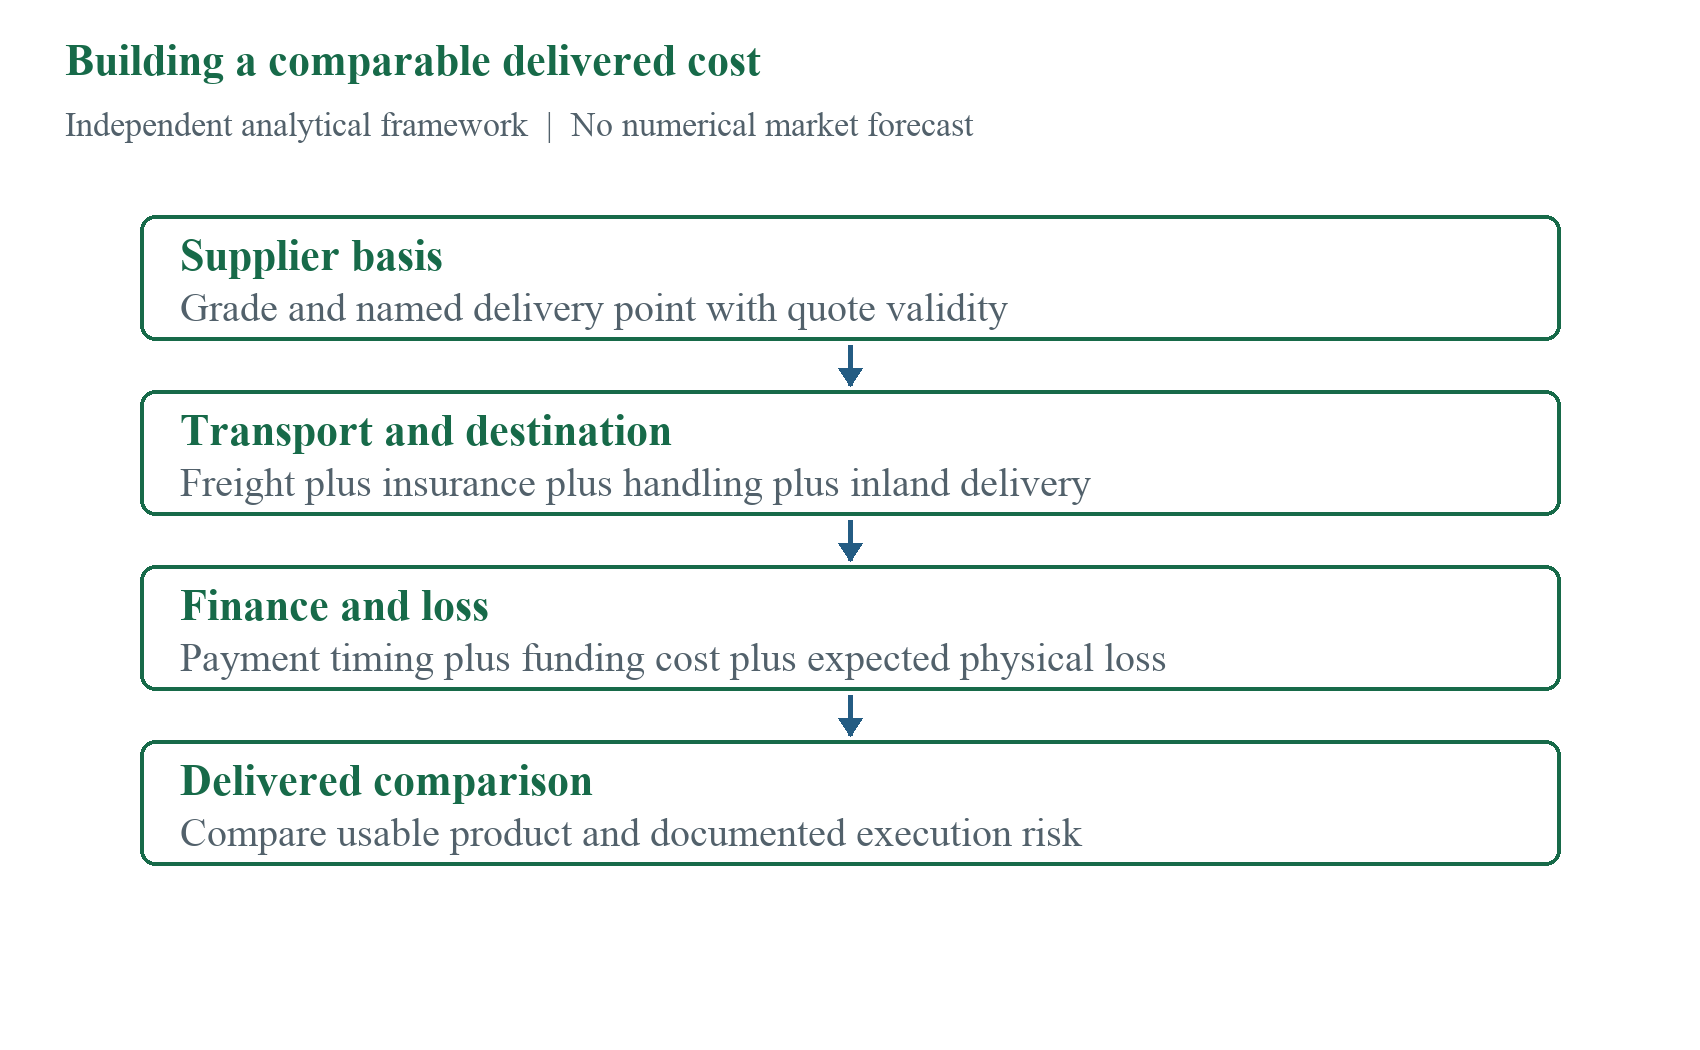
Figure 11. Independent delivered-cost bridge. Components require cargo-specific input; the diagram contains no invented market values.
Use one comparison point and one quantity unit. Record duties and loss treatment explicitly, and avoid double-counting a cost already included in the seller’s Incoterm. Compare both invoice cost and cash timing. A cost difference that disappears after normalization should not be reported as a purchasing saving.
Freight monitoring dashboard
- Indicative freight by route, parcel size, and vessel class, with explicit tracking of the spread between the low and high end of each quoted range.
- Vessel nominations, arrival dates, and actual strait crossings, rather than nominal loading programs.
For cargoes dependent on inland waterways, monitor the relevant authority’s gauge readings and obtain current barge quotations; do not carry historical barge constraints forward without dated evidence.
For canal-dependent routing, monitor official slot availability, restrictions and transit performance. Treat each published change as route-specific evidence rather than a universal freight signal.
11. Regional Market Synthesis
| Region | September anchor | Use | Missing evidence |
|---|---|---|---|
| US Pacific Northwest | USDA 18 September | Regional distributor comparison | Cleared transaction prices |
| North America | Methanex September USD 1,414/metric ton | Posted reference only | Net realized contract price |
| Persian Gulf | KBR and Samsung project disclosures | Future capacity context | Prompt allocation and freight |
| India | NFL DAP import tender | Procurement notice only | Awarded product volume |
| Asia Pacific | Methanex September USD 550/metric ton | Posted contract reference | Destination spot offer |
| China | Methanex September USD 525/metric ton | Posted contract reference | Export volume and availability |
| Europe | EIA annual forecast context only | Use plant-specific energy data | September regional gas contract |
| Brazil and Africa | No price series asserted | Destination-specific offer framework | Comparable September public series |
Americas
Distinguish the September Pacific Northwest distributor observations from delivered Latin American offers and Canadian supplier allocations. Methanex’s September-valid North American reference has a different product, basis, and pricing system. Confirm destination, grade, quantity, payment, and delivery before comparing any of these with a supplier bid.
Europe, Asia and the Persian Gulf
Regional energy and logistics differences can create distinct delivered outcomes. The September EIA outlook, official Indian procurement notices and SABIC investment disclosure illuminate different parts of the chain. Their dates and commercial relevance must remain visible. Compare executable product offers with consistent terms rather than combining energy forecasts, future capacity and tender activity into one unsupported price-direction claim.
Africa and food-security considerations
Procurement design should reflect payment capacity, port and inland handling, seasonal need and product suitability. A shipment arriving after the application window can lose much of its economic value even when its price is attractive. Coordinate credit, discharge and inland delivery before award. This edition provides an operating framework for African destinations without publishing unsupported September country-level volumes or quotations.
Regional comparison: what changes the landed result
Use one bid sheet for the compared destinations and suppliers. Record the product basis, freight, port cost, inland cost, insurance, credit, and usable delivery date. Investigate any unusually low offer through specification and execution checks before treating it as a saving.
Country watchlist for October and November
Independent monitoring plan: review official Indian tender awards, confirmed Chinese export offers, Brazilian receiving and customer timing, European energy assumptions, and Persian Gulf cargo execution. Record the date, source, and transaction relevance of each change. Monitoring priorities are recommendations, not forecasts, for those markets.
12. Scenario Outlook
The outlook comprises independent qualitative planning scenarios. No numerical probabilities or product-price targets are assigned because a validated forecasting model and complete September public spot dataset are unavailable.
| Scenario | Publicly observable conditions | Expected exposure | Management posture |
|---|---|---|---|
| Base case | September public signals remain mixed | Regional basis and freight differences persist | Stagger coverage and require executable offers |
| Tight case | Route, plant or tender disruption | Prompt premiums and working-capital needs rise | Protect critical volumes and diversify |
| Relief case | Improved availability and logistics | Delivered competition increases | Preserve optionality and avoid overstocking |
Leading indicators
Nutrien and Mosaic quarterly guidance revisions on potash volumes
India’s official fertilizer procurement notices, awards and shipment updates.
Base-case narrative
Independent scenario: assume required supply can be sourced through qualified counterparties, with material differences in delivered cost and lead time. Cover firm needs in stages and retain options for later volume. This is a planning case, not a numerical forecast. Review it when confirmed awards, supplier availability, route acceptance, or customer requirements change; each review should use a dated decision record.
Stress and relief cases
Scenario sensitivity map
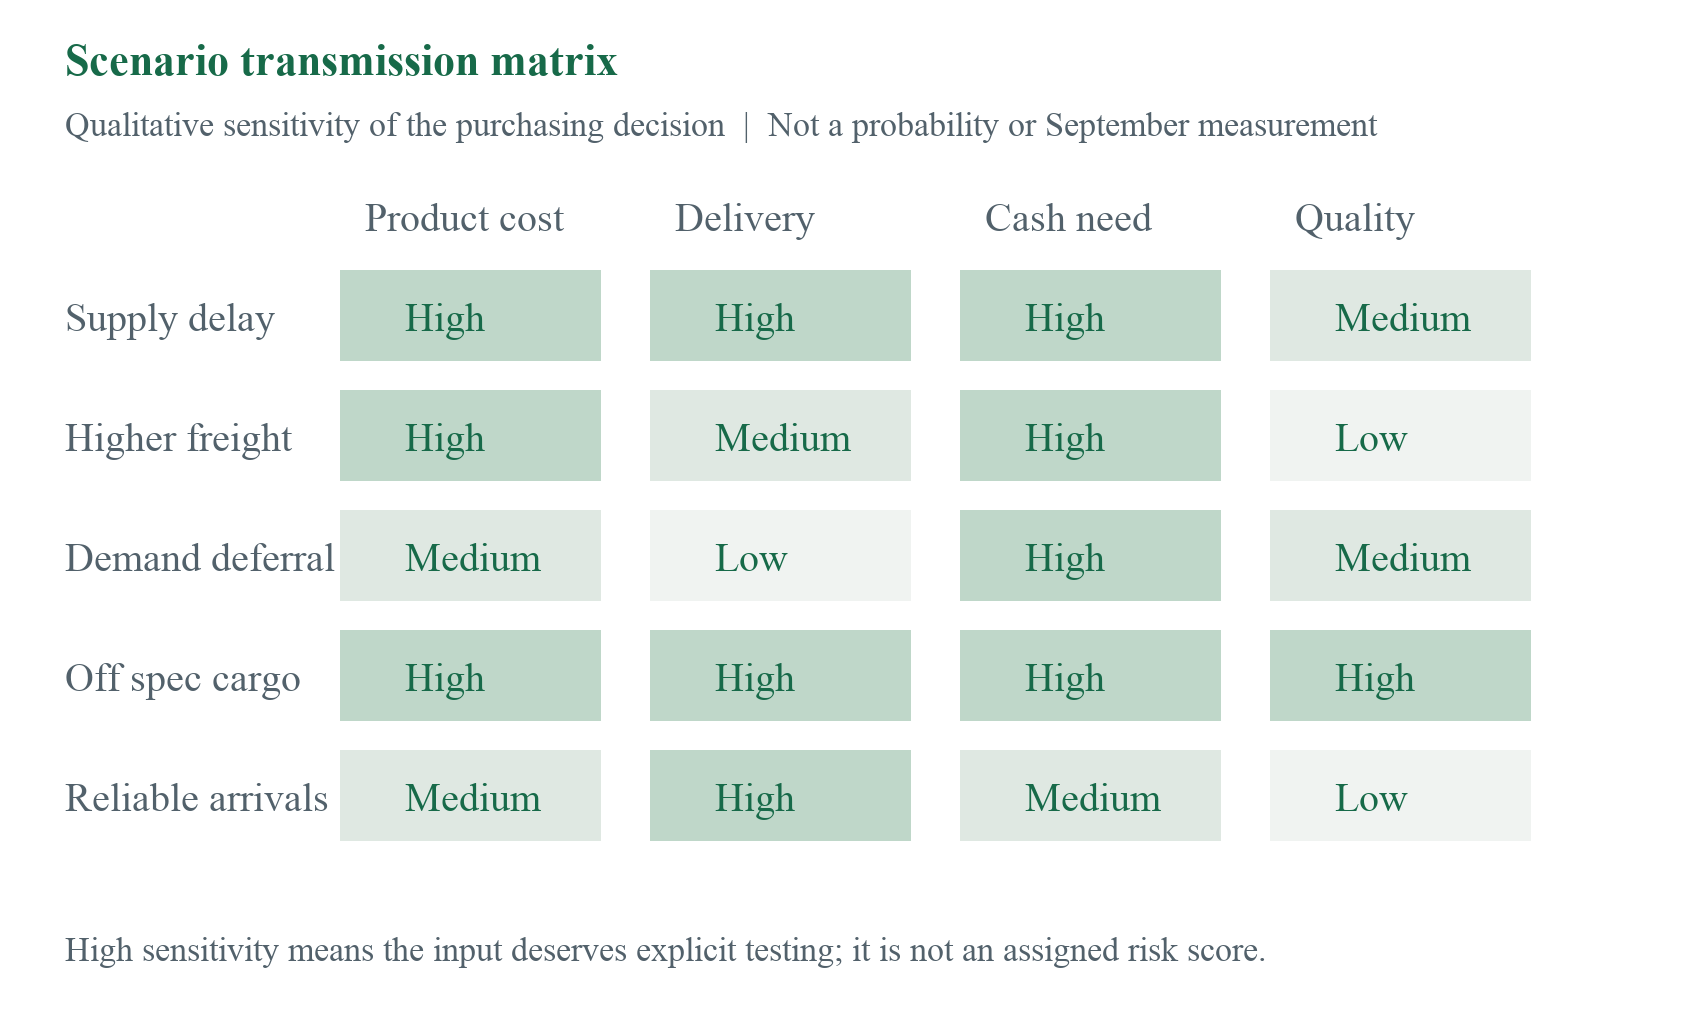
Figure 12. Independent qualitative scenario matrix. Sensitivity labels describe which inputs need testing and carry no numerical probability, risk score, or observed September severity.
Use the matrix to decide what to vary in an internal model, not to forecast market direction. A supply delay can affect delivery and cash at once; a demand deferral can tie up cash without a new freight shock. Enter the organization’s own dates, amounts, and approved assumptions before quantifying any scenario.
Independent scenarios: a stress case combines delayed shipment, reduced qualified supply, or higher logistics and finance costs. A relief case assumes improved delivery reliability and more competitive executable offers. Test each against critical stock, cash headroom, and customer commitments. These cases carry no assigned probability and do not predict a specific September or October price.
Scenario governance
Do not assign numerical probabilities unless management approves a repeatable forecasting method.
Product behavior by scenario
Dry-bulk nutrients, ammonia, and methanol have different transport and storage constraints. Test substitution only where the specification and downstream process allow it. In a stress case, protect products whose interruption has the greatest operational consequence. In a relief case, avoid purchasing beyond usable storage or firm demand solely because an offer is lower. Product-level controls are more useful than one blanket inventory response.
Trigger matrix
Define a trigger, evidence source, owner, response, and expiry for each material exposure. Examples include a confirmed route restriction, a supplier failing to nominate cargo, stock below an approved minimum, or a rejected inspection. Thresholds should come from the organization’s risk appetite and operating data. A news item without confirmed transaction relevance should prompt verification before a purchasing change.
Financial effects of the scenarios
Evaluate gross margin and cash separately. Higher product or freight costs increase funding needs; longer transit can increase inventory carry without changing the invoice price. Model each cargo’s payment date, arrival, customer receipt, and collection date. Present assumptions and sensitivities explicitly and avoid treating a price forecast as sufficient evidence for a financing decision.
13. Strategic Conclusions and Recommendations
Central conclusion: September public evidence supports disciplined differentiation rather than a single global price narrative. Use public benchmarks and dated announcements as context, then base procurement on current supplier quotations, verified specifications, route terms, insurance, financing, and destination costs.
| Priority | 0–30 days | 30–90 days | 90+ days |
|---|---|---|---|
| Procurement | Map supplier, origin, and delivery exposure | Qualify alternatives using public evidence and executable quotations | Maintain a diversified sourcing portfolio |
| Inventory | Confirm critical stock and consumption data | Set product-specific reorder triggers | Review resilience targets quarterly |
| Freight | Separate freight, insurance and delay clauses | Pre-negotiate route and insurer options | Maintain a multi-corridor playbook |
| Finance | Review counterparty, FX and working-capital exposure | Expand approved financing options | Integrate landed-cost risk limits |
| Intelligence | Use official and publicly accessible sources | Maintain a source register and archive | Audit publication rights before each report |
Product-specific guidance
Apply the following recommendations using current specifications and shipment evidence. Public monthly references, corporate guidance, and posted prices serve different purposes and cannot replace an executable quotation. Assign each product a coverage policy based on lead time, storage, quality, and the cost of interruption. Reassess the policy when an actual supplier or customer condition changes.
| Product | Recommended posture |
|---|---|
| Urea | Use the September regional ask only as context; obtain current destination-specific offers. |
| Ammonia | Do not infer prompt supply from the SABIC investment announcement; verify executable availability. |
| Sulfur | Use supplier offers and inventory evidence; no proprietary September assessment is reproduced. |
| DAP/MAP | Bridge public benchmarks to grade, origin, freight, subsidy, and credit terms. |
| Potash | Compare grade and FOB distributor basis separately from seaborne offers. |
| NPK | Compare cost per usable nutrient and verify formula, packaging, and caking risk. |
| Methanol | Separate September-valid references from October postings announced in September. |
Procurement architecture
Combine qualified base supply with staged discretionary purchases according to demand visibility. Measure concentration across plant, port, route, bank and insurer as well as supplier name. Alternative suppliers should be technically and commercially ready before they are needed. Record why an award offers the best total value, including reliability and cash effects.
Inventory and financial management
Distinguish operating stock, safety stock, committed sales and in-transit inventory. Use confirmed consumption and arrival evidence to determine usable coverage. Maintain liquidity for delayed documents or shipment changes. Report replacement margin, historical margin, and accounting valuation separately so a profitable sale does not obscure the cost of replenishing the position.
Market-intelligence operating model
Maintain a small evidence register that records publisher, observation period, publication date, basis, URL, and use in the decision. Archive permissible public documents and retain supplier quotations within authorized internal systems. Reconcile report tables and charts against the same controlled values. Assign ownership for updates and corrections rather than adding unsupported detail to extend coverage.
Executive action checklist
Require landed-cost decomposition for major purchases, isolating the sulfur/freight/insurance components from the base commodity price.
Track official Indian tender and policy publications and evaluate their effect on phosphate producer economics only after the responsible authority confirms the measure.
Retain licensed benchmark access for negotiations where exact spot values are commercially material.
Governance and decision rights
Set written authority for coverage, supplier allocation, credit, route changes and exceptions. A time-sensitive cargo should have a named escalation path. Decision records should identify the evidence available at award and the assumptions accepted. Review exceptions after execution to improve thresholds and controls; avoid judging a decision solely by a later market price.
Supplier and counterparty scorecard
Counterparty limits should incorporate both financial exposure and operational dependence. A small supplier can be critical if it provides a unique grade or route; a large supplier can create concentration through multiple contracts, particularly where several counterparties ultimately depend on the same constrained corridor. Parent guarantees, letters of credit, and insurance reduce some risks but do not replace operational due diligence, especially as insurers may reassess their appetite for Persian Gulf-linked risk.
Scorecards should use recent evidence and be updated after every material cargo. Their purpose is to guide allocation and negotiation, not merely to rank suppliers once per year. September tender activity and investment announcements reinforce the need to distinguish prompt commercial evidence from longer-horizon signals.
Implementation roadmap
Implement data governance alongside commercial actions. Licensed benchmark access, source archives, unit normalization, and version control prevent future reports from mixing illustrative and verified figures. Charts should be generated directly from controlled data tables.
Evidence and execution decision sequence
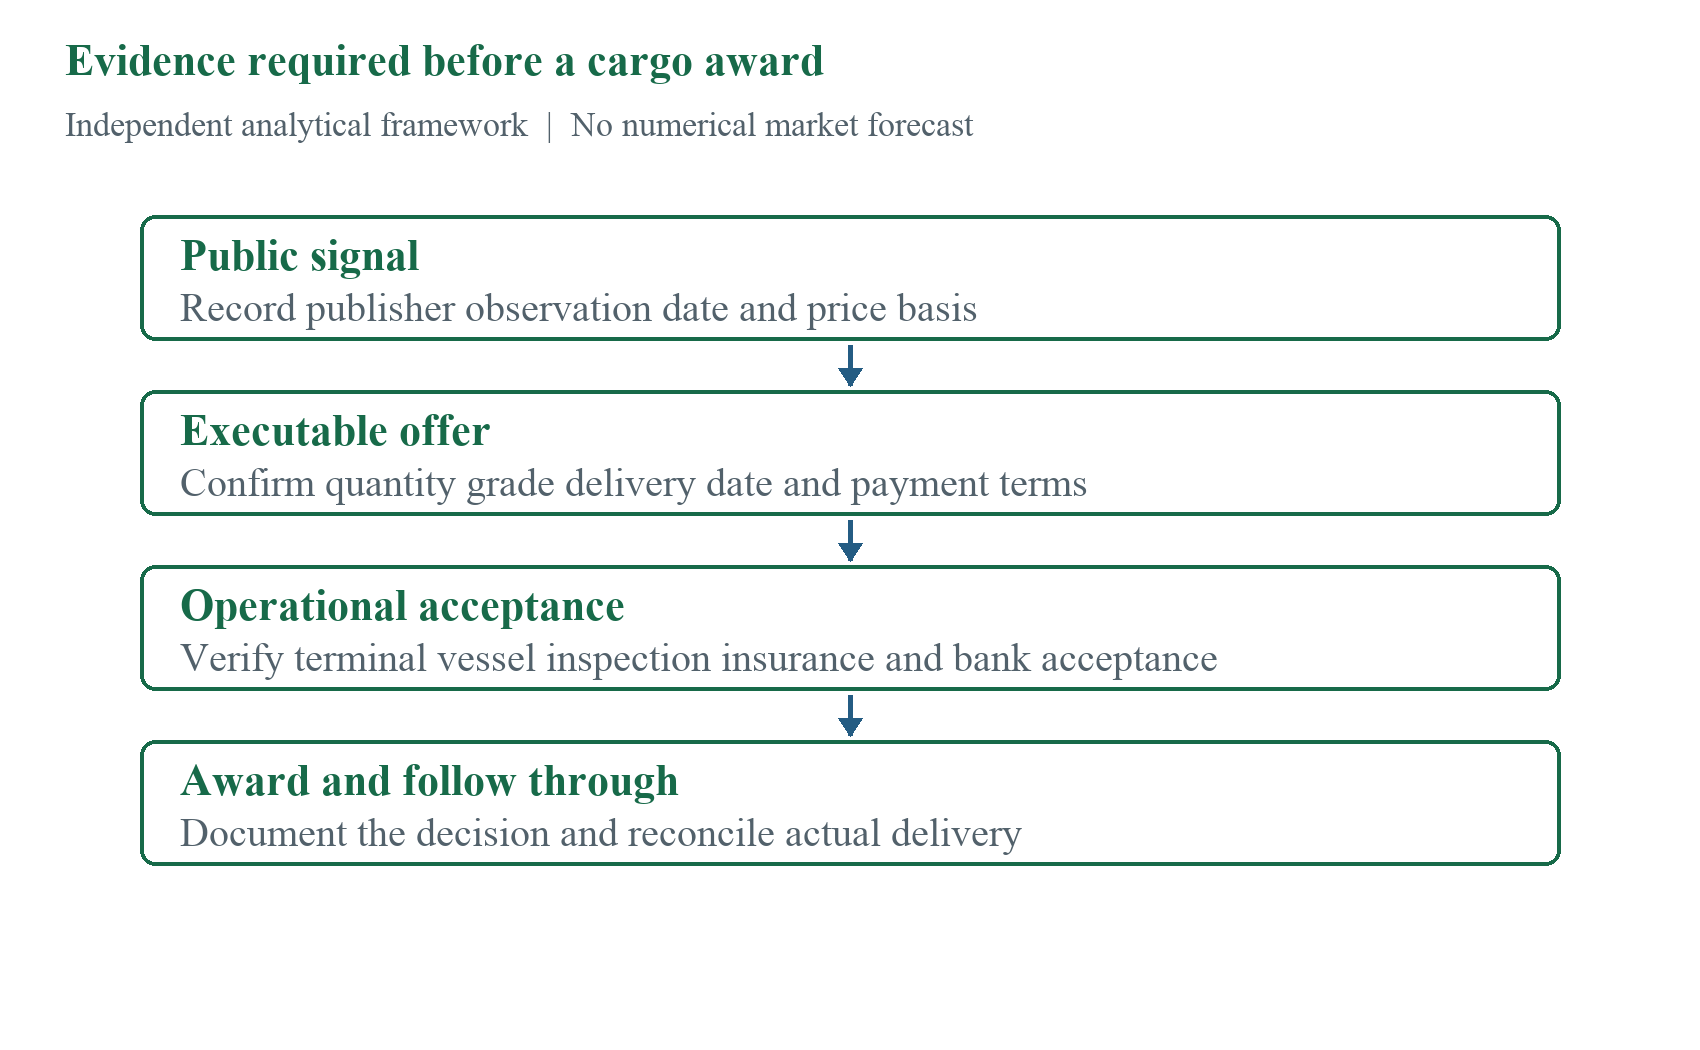
Figure 13. Independent decision sequence separating a public market signal from an executable cargo award.
14. Detailed Country and Trade-Flow Profiles
Purpose: This chapter converts the regional overview into operational country profiles. It focuses on how policy, logistics, finance, and crop cycles translate global benchmarks into executable trade.
China: production, consumption and export optionality
Verify offered export availability, product approval, documentation, and loading schedule through the supplier and relevant official channels. Domestic pricing and export terms can differ in basis and eligibility. This edition does not reproduce private Chinese price or inventory assessments and makes no unsupported September export-policy change claim. Maintain alternatives until the actual cargo’s eligibility and timing are confirmed.
India: tender-led procurement and subsidy exposure
The government listing identifies an NFL tender for loose-bulk fertilizer-grade DAP imports at WCI, published on 14 September, reference NFL/CO/SC/2026-27/DAP/04 and tender ID 2026_NFL_290742_1. The listed closing date is 17 September. This is a procurement notice, not an award, agreed price, or shipped quantity. Confirm the official outcome before estimating physical demand. Source: Government NFL tender listing
Brazil: import dependence, credit, and seasonality
Evaluate Brazilian purchases through the specified discharge port, inland delivery, application window, customer credit, and dated currency assumptions. Confirm supplier allocation and destination handling before award. This edition publishes no unverified September import volume, spot price, or port policy for Brazil.
United States and Canada
The US regional evidence in this edition is the USDA Pacific Northwest asking panel dated 18 September. It provides product comparisons for that location and basis, not Canadian producer realizations or a global sales forecast. Obtain a destination-specific offer before estimating a North American landed position. Source: USDA regional panel
Morocco, North Africa, and the Persian Gulf
Compare suppliers through specification, load port, parcel, freight, finance, and delivery certainty. Integrated production and geographic access provide context, but do not establish a prompt export offer. The SABIC project adds a dated long-term investment signal to the Persian Gulf profile. For current purchases, obtain written cargo-readiness and route confirmation, and keep a qualified alternative.
Southeast Asia, Africa and emerging demand
Destination requirements vary by crop, formulation, storage and distribution system. Compare nutrient value and local application needs before choosing a nominally cheaper product. Seasonal timing, small parcels and credit can dominate delivered economics. No September regional demand-growth percentage is supplied here because the underlying comparable public evidence was not established.
15. Product Cost and Margin Mechanics
Analytical principle: A benchmark price serves only as a market reference. Commercial margin requires a complete bridge from feedstock and conversion through freight, finance, and realized selling price.
Ammonia and urea cost chains
Urea economics add carbon dioxide integration, conversion chemistry, granulation or prilling, storage, and loading to the ammonia base. Export margin should always be calculated from FOB realization less variable production, terminal, and commercial costs — not from a headline benchmark price alone. Delivered competitiveness then requires adding ocean freight, insurance, and destination charges, and this is where routing risk becomes decisive: when a corridor is disrupted or freight rates spike, a structurally low-cost Persian Gulf plant can temporarily lose its delivered-cost advantage to a higher-cost Atlantic Basin or North American origin serving the same destination. Traders modeling delivered urea competitiveness into Brazil or South Asia this month should therefore run the comparison on current freight, not on a seasonal average.
Sulfur and phosphate cost transmission
DAP and MAP margins require a full accounting of phosphate rock, sulfur, ammonia, utilities, conversion yield, maintenance and freight. Integrated producers can transfer value between stages and adjust destination mix; independent buyers should therefore model the full delivered chain rather than infer margin from one feedstock or benchmark.
Potash mining and delivered economics
Potash cost structures include mining or solution mining, processing, maintenance, royalties, taxes, rail haulage and terminal charges. Public FOB-mine guidance excludes the logistics and finance components that can materially change delivered cost in offshore markets.
A potash model should separate product acquisition from processing where applicable, inland transport, terminal handling, ocean freight and destination charges. Quantity offered, committed allocation, and nominated shipment are different stages of availability; record them separately.
NPK formulation and blending margin
A finished NPK cost model should begin with the precise recipe and nutrient assay, not a generic raw-material cost share. Adjust raw-material tonnage for nutrient concentration, moisture content, and expected process loss before converting it into a meaningful cost-per-nutrient-ton figure. Then add conversion energy, steam, utilities, additives, packaging, labor, quality control, finance, and freight. Blenders who rely on published percentage cost breakdowns as anything more than an initial screening tool risk systematically mispricing formulations whose raw-material mix diverges from the generic assumption.
Methanol realization bridge
Methanol posted prices function only as starting references. Realized value can diverge from the posting through negotiated discounts, customer-specific formulas, freight, terminal costs, product loss in transit and storage, and currency effects. A North American contract posting and a Chinese spot assessment are not directly comparable without a clear understanding of each market’s respective conventions for quotation basis, payment terms, and included costs.
Producer margin in methanol depends on the underlying feedstock — natural gas or coal — plant conversion efficiency, operating rate, and destination market. Downstream demand from methanol-to-olefins conversion, formaldehyde production, acetic acid manufacturing, and fuel-blending applications all influence the balance that ultimately determines realized price. Commercial reporting for methanol should therefore explicitly separate posted, spot, contract, and net realized prices, since conflating these categories—as with the NPK inventory-versus-manufacturing distinction above—tends to overstate or understate true trading performance.
Sensitivity analysis
Sensitivity models should vary product price, feedstock cost, freight, foreign exchange, interest, utilization, and working-capital days separately and in combination. The objective is to identify threshold breaches, not to imply forecasting precision unsupported by public evidence.
For major purchases, the buyer should calculate delivered cost under base, stress, and relief scenarios, varying freight and FOB assumptions independently rather than moving them together. For production planning, management should compare the economics of continuing to run, temporarily curtailing, and substituting imported intermediate product, using the same base/stress/relief framework applied on the buy side. Every sensitivity model output should state its source date, unit of measurement, Incoterm basis, and whether each input value is an observed market price or an internal assumption, so that downstream users of the analysis can distinguish fact from estimate at a glance.
16. Procurement and Contracting Playbook
Portfolio design
A resilient procurement portfolio combines base-load term contracts, formula-linked agreements, and tactical spot purchases. Term supply protects continuity of physical availability, formula-linked agreements share market risk between buyer and seller over the life of the relationship, and spot cargoes preserve flexibility and support ongoing price discovery. The right mix depends on the product's criticality to downstream operations, available storage capacity, typical order-to-delivery lead time, and the depth and liquidity of the relevant spot market.
Measure diversification across origin, producing plant, loading port, shipping corridor, vessel class, financing bank, and cargo insurer—not merely across counterparty names. Multiple supply contracts offer little genuine risk reduction when they all depend on the same constrained route or chokepoint, especially when cargo-specific route constraints apply. Allocation decisions among qualified suppliers should reward both competitive pricing and a proven track record of execution, since a marginally cheaper offer from a supplier with a weak delivery history can prove far more expensive once you include delays, claims, and substitute-sourcing costs.
Pre-tender preparation
Before an inquiry, define the product specification, quantity tolerance, parcel, shipment window, destination capability, inspection and payment terms. Missing grade, moisture, or form information can prevent like-for-like bid comparison and create avoidable disputes. Resolve those differences before award.
The inquiry should require Incoterm, named port or delivery point, freight inclusion, insurance, taxes, USD settlement basis, offer validity, and escalation mechanism. Where a route exposure is relevant, obtain the producing plant, terminal, and vessel requirements. This is a recommended disclosure rule, not a finding that a particular September corridor was constrained.
Offer normalization and award
Offers received in response to a tender or inquiry should be normalized to a common delivered basis and a common nutrient basis before comparison. This normalization must account for quality differences between offers, freight to the actual discharge point, insurance, financing costs, duty, port handling costs, inland transport to the final destination, and expected in-transit loss. A risk-adjusted comparison can also quantify the expected cost of delay or non-performance for each offer, provided it makes the probability and cost assumptions underlying that adjustment transparent to all internal stakeholders reviewing the award.
Award decisions should record both the commercial rationale and the operational rationale in writing. Splitting volume across more than one supplier can reduce counterparty concentration risk, but it may also raise per-unit freight cost or complicate quality control at the receiving end, so the decision to split should be a deliberate trade-off rather than a default. The chosen award strategy should be explicitly linked to current inventory coverage and the availability of alternative supply, so that the rationale remains auditable if market conditions change materially before the cargo is delivered.
Essential contract clauses
Contracts should define, at minimum: product specification and tolerance, inspection method, sampling procedure, laycan, vessel nomination process, loading rate, discharge rate, demurrage and despatch terms, title transfer, risk transfer, payment mechanism, sanctions language, force majeure, safe-port warranty, deviation rights, and claims procedure. Ambiguity in any of these clauses is least costly when nothing goes wrong and most expensive precisely when a disruption occurs — which is exactly when the clause is actually tested.
Index-linked pricing provisions require a precise benchmark name, the specific publication that produces it, the unit of measurement, the averaging period used to derive the applicable price, the settlement currency, and an explicit fallback mechanism to be used if the assessment becomes unavailable during the life of the contract. The contract should document freight adjustment mechanisms, quality-premium or discount schedules, and tax treatment rather than leaving them to informal understanding between the commercial teams that negotiated the deal, since those individuals may not be administering the contract when a dispute arises.
Performance and claims
Track supplier performance systematically against on-time loading, documentation accuracy and timeliness, product quality on arrival, quantity delivered against contract, responsiveness to buyer queries, and the speed and fairness of claims resolution. A formal claims procedure must specify the notice period for raising a claim, the evidence required to substantiate it, and the independent inspection body or method used to resolve disputed quality or quantity questions. Retained samples should be held under an agreed chain-of-custody procedure, so their evidentiary value cannot later be challenged on procedural grounds.
After each materially sized cargo, procurement, logistics, and quality teams should conduct a structured closeout review. Lessons learned regarding port performance, vessel suitability for the route and cargo type, documentation handling, and product condition on arrival should feed directly into the scorecards used for future supplier qualification and allocation decisions, so that the organization’s procurement capability compounds over successive cargoes rather than resetting with each new transaction.
Ethics, sanctions and compliance
Independent compliance recommendation: assess ownership, beneficial owners, counterparties, vessel history, applicable restrictions and the payment chain. Confirm the requirements with qualified counsel and participating banks or insurers before commitment. This report does not certify the legal status of any party, vessel, or route.
Independent compliance recommendation: contractual assurances do not replace screening and operational acceptance. Obtain written confirmation from banks and insurers where required, date the evidence, and escalate unresolved questions. Service providers may apply their own eligibility policies, so their participation should not be assumed.
17. Inventory and Working-Capital Framework
Inventory segmentation
Divide inventory into operational stock, safety stock, strategic stock, committed transit, and optional supply. Operational stock supports normal production or sales. Safety stock covers delivery variability. Strategic stock protects against low-probability disruption. Transit stock is counted only based on realistic arrival probabilities.
Independent inventory framework: each product needs a policy tied to actual storage, consumption, replenishment lead time, and the consequence of interruption. Keep elemental sulfur, industrial urea, NPK grades, and liquid products distinct. The report assigns no universal days-of-cover target or unsupported relative volatility ranking.
Reorder points and trigger bands
Reorder points should account for expected demand during lead time, lead-time variability, and the service target. Market triggers can temporarily raise or lower coverage bands. Confirmed route disruptions, fewer vessel departures, or supplier outages can justify additional safety stock; weaker demand and improving logistics can reduce it.
Triggers should be defined before a crisis. If management changes coverage without recorded evidence, the organization may repeatedly buy high and sell low. A formal band preserves discipline while allowing authorized exceptions. The same discipline that a mature framework applies to freight and demand triggers should also apply to abrupt counterparty or jurisdictional triggers: the announcement of a broad-based trade suspension between two markets, for example, is precisely the sort of externally imposed, non-gradual event that a pre-agreed trigger band is designed to accommodate without requiring an emergency policy debate in the moment.
Working-capital calculation
Independent cash framework: model product payments, freight, duty, storage, receivables and payables by their actual dates. Higher values and longer transit can increase cash exposure together. Financing fees depend on the agreed facility; insurance charges do not automatically move in proportion to product price.
Finance should forecast cash by cargo and product, not only by monthly aggregate. Letters of credit, margin deposits, prepayments, and delayed documents can create timing peaks. Secure liquidity before procurement windows become urgent. When a planned production outage at a major supplier is publicly known well in advance—as with a multi-week turnaround schedule—working-capital planning has lead time; the same discipline should still price in the possibility that a scheduled outage runs longer than announced, since maintenance windows are estimates, not guarantees.
Inventory valuation and price risk
High-cost inventory is exposed when replacement values fall. The organization should separate physical security from speculative length. Back-to-back sales, price formulas, hedges where available, and measured coverage reduce inventory mismatch.
Valuation reports should distinguish realized margin, replacement margin, and accounting inventory effects. A profitable historical sale can conceal a weak replacement position, while an accounting loss can coexist with improved future purchasing economics. Replacement values should be based on dated, executable offers.
Storage and product integrity
Storage limits are both physical and financial. Urea and NPK require moisture and caking control. Sulfur requires fire, dust, and environmental management. Methanol requires appropriate tanks and safety systems. Moisture and segregation can affect potash quality.
The inventory strategy should account for warehouse capacity, handling rates, bagging, blending, and discharge constraints. Buying beyond usable capacity transfers risk from the market to operations.
Inventory governance dashboard
- Available, committed, in-transit, and at-risk volume by product and location.
- Days of cover under base and stress demand.
- Expected arrivals with vessel and document status.
- Average cost, replacement cost, and potential inventory exposure.
- Storage utilization, quality exceptions, and aging.
- Supplier, origin, and corridor concentration.
- Regional port-stock benchmarks for key inputs (e.g., sulfur), tracked against the prior-year comparison to flag structural, rather than seasonal, drawdown.
18. Quality, Specification and Claims Management
Specification governance
Every purchase should reference an approved product specification and test method. Chemical assay alone is insufficient: physical properties determine handling, blending, and field application. Specifications should distinguish guaranteed limits, typical values, and information-only parameters.
Changes in the producer, plant, production route, or raw materials can affect performance even when the nominal grade remains unchanged. Supplier change control and sample approval are important for critical applications and branded products. A planned turnaround, followed by a restart, is a recognized moment at which a producer’s output can shift in ways not immediately visible on a certificate of analysis; specification governance should treat the resumption of production after an extended outage as a trigger for renewed sample verification rather than an automatic return to the prior approval.
Urea and nitrogen-product quality
Granular and prilled urea differ in particle size, hardness, and application. Relevant parameters include nitrogen content, moisture, biuret, particle-size distribution, crushing strength, and free ammonia. Agricultural and industrial uses may have different tolerance requirements.
Ammonium sulfate can be crystalline, compacted, or granular, depending on the production route. Nitrates and UAN require concentration and safety controls. Comparing products on price without normalizing nutrient concentration and physical form can create false savings.
Ammonia quality and supply reliability are closely linked. A planned, multi-week turnaround at a major ammonia plant, or an extended strategic review at another, can each affect the mix of origins available to buyers over a given quarter; specification governance for ammonia-linked products should confirm current source and production status at the point of contracting rather than relying on a standing supplier list.
Sulfur and phosphate quality
Sulfur may be granular, formed, lumpy, or molten. Purity, ash, acidity, moisture, particle condition, and handling losses affect use. Dust and fines can create safety and environmental issues. Sampling heterogeneous cargo requires an agreed, representative method.
Potash, NPK and methanol
MOP and SOP differ chemically and agronomically. Grade, potassium content, moisture, particle size, and color may affect use and customer expectations. NPK requires verification of each declared nutrient, physical uniformity, and resistance to caking and segregation.
Methanol quality depends on purity and controlled impurities, with separate safety and handling requirements. Tank cleanliness and previous cargo are critical. Chemical contamination can render a cargo unsuitable even when quantity and delivery are correct.
Sampling, inspection and laboratories
Sampling plans should specify location, timing, increment count, composite preparation, sealing, and chain of custody. Loading inspection can prevent disputes that are difficult to resolve after discharge. Independent inspectors should be competent for the product and the port.
Laboratory methods must be named and compatible. When buyer and seller results differ, the contract should define the referee laboratory and tolerance. Retained samples should remain sealed for the duration of the claim period.
Claims process
Claims require timely notice, evidence, mitigation, and quantification. Quantity claims may depend on draft survey, shore scale, or tank measurement. Quality claims require samples, certificates, photographs, handling records, and laboratory reports. Delay claims require contractual and operational records.
Commercial teams should avoid informal settlement before technical review. The organization should record the root cause, recovery, and corrective actions to prevent recurring losses resulting from changes in supplier qualifications or contract terms. Where a claim’s timing coincides with a known supplier event — a planned turnaround, a restart, or a change of ownership review at the production facility — the root-cause analysis should explicitly consider whether that event, rather than an isolated quality lapse, explains the deviation, since the corrective action required differs materially between the two cases.
19. Risk Register and Internal Controls
| Risk | Example event | Primary control | Owner |
|---|---|---|---|
| Price | Public benchmark changes rapidly | Coverage bands and verified executable quotations | Commercial |
| Freight | Route or vessel cost rises | Alternative routes and freight clauses | Logistics |
| Supply | Official outage or export restriction | Supplier diversification and safety stock | Procurement |
| Quality | Off-spec cargo | Approved specifications and inspection | Quality |
| Credit | Customer or supplier default | Limits, security and monitoring | Finance |
| FX | Local currency depreciation | Currency matching and hedging policy | Finance |
| Compliance | A government restriction affects a party, vessel or payment chain | Screening and legal review | Compliance |
| Operational | Port or warehouse cannot perform required handling | Capability checks and contingency plan | Operations |
Risk scoring methodology
Score risks by likelihood, financial impact, operational impact, and speed of onset. A low-probability event may require strong controls if it can stop production or create legal exposure. Speed matters because some risks allow time to source alternatives while others require an immediate response — a scheduled, multi-week plant turnaround announced in advance sits at one end of that spectrum, while a same-day trade suspension between two counterparty jurisdictions sits at the other.
Scores should reflect residual risk after controls, not the uncontrolled scenario. Assumptions, evidence, and review date should be recorded. The purpose is prioritization and action, not a mathematically precise forecast.
Price and basis risk
Price risk includes movements in the selected benchmark. Basis risk arises when the organization’s actual product, location, or timing differs from the benchmark. A hedge or formula can reduce benchmark risk while retaining exposure to freight, quality, or regional spread.
Supply-chain and geopolitical risk
Supply risk can arise from plant failure, export policy changes, maritime attacks, port closures, labor actions, weather, or vessel shortages. Supplier diversification and inventory are common controls, but both have costs. Contingency plans should identify alternative products and destinations before a disruption occurs.
Source security information from authoritative maritime and government channels. Market rumor can guide an investigation but should not, by itself, trigger irreversible action.
Counterparty and credit risk
Supplier default can remove critical volume; customer default can convert inventory into an unplanned position. Limits should incorporate exposure, financial strength, country risk, payment security, and operational dependence. Prepayment requires particular care.
Control testing and incident review
Test controls through sample transactions, document review, and scenario exercises. Tabletop exercises should include scheduled outages, sudden route restrictions, payment-channel disruption, and counterparty failure to test response times and decision authority under both predictable and unexpected conditions.
After incidents, a structured review should identify the root cause, the control failure, the financial impact, and the corrective action. Lessons should update contracts, scorecards, and training rather than remain in a narrative report.
20. Market Monitoring and Early-Warning System
Dashboard architecture
The monitoring system should combine price, physical flow, logistics, demand, financial, and geopolitical indicators. Prices describe the outcome; physical indicators often provide earlier warning. The dashboard should show the source, timestamp, unit, and whether the data are observed, estimated, or internal.
A small set of trusted indicators is more useful than a large ungoverned feed. Each metric should have an owner, an update frequency, a threshold, and a corresponding decision. Retain historical values to identify regime changes.
Nitrogen indicators
- India tender announcements, awards, shipment windows, and executed volume.
- Chinese urea and phosphate export policy, inspections, and offers.
- Persian Gulf, North African, Chinese, and Atlantic production outages.
- Urea FOB/CFR benchmark spreads and destination netbacks.
- Henry Hub, TTF, and other relevant feedstock indicators.
- Brazil import pace, NOLA seasonality, and regional inventory.
Ammonia and methanol indicators
- Major plant outages, restarts, and planned maintenance.
- Specialized vessel availability and terminal schedules.
- Downstream operating rates and industrial margins.
- Gas or coal feedstock economics by production region.
- Posted prices, discounts, and realized-price evidence.
- Spread between contract settlement and prevailing spot assessment, to flag when the two series diverge materially in either direction.
Sulfur and phosphate indicators
- Persian Gulf producer prices, cargo offers, and vessel departures.
- Moroccan sulfur procurement and phosphate export programs.
- Sulfur freight by route and parcel size.
- Brazil MAP import pace and grower affordability.
Potash and NPK indicators
- Producer sales and production guidance.
- Canadian rail and terminal performance.
- Russian and Belarusian trade-route and sanctions developments.
- China and India contract negotiations.
- Demand indicators for Brazil, Southeast Asia, and North America.
- Raw-material replacement cost for major NPK formulations.
Logistics and security indicators
IMO, flag-state, insurer, and trusted security updates should be distinguished from commercial market commentary. The dashboard should highlight changes that affect crew safety, legal transit, or insurance rather than attempt to predict political outcomes.
Alert levels
A green status indicates normal monitoring and approved coverage. Amber indicates a threshold breach that requires review—such as widening freight, delayed vessels, or falling inventory. Red indicates a confirmed condition requiring action, such as loss of a supplier, closure of a route, or breach of minimum stock.
Alerts should have expiry and review times. Without closure rules, dashboards remain permanently amber and lose value. Every red alert should record management action and communication.
21. Commercial Decision Framework
From market view to decision
A market report becomes valuable when it changes a decision. The commercial process should begin with the business requirement, define acceptable risk, evaluate alternatives, and document the selected action. Market direction is one input, not the conclusion.
Buy, wait, or split
A buy decision is appropriate when the physical requirement is firm, coverage is below target, or execution risk outweighs the potential price decline. Waiting is appropriate when stock is sufficient, offers are poorly executable, or downside evidence is strong. Splitting reduces timing risk and is often the default under uncertainty.
The chosen action should specify the quantity, price basis, window, origin, expected landed cost, scenario, and invalidation trigger. This allows for later evaluation of decision quality rather than judging solely by the price outcome.
Supplier allocation decision
Allocation should consider the risk-adjusted total value—price, quality, reliability, documentation, compliance, freight, and relationships all matter. A weighted score can support judgment, but weighting should reflect product criticality and be approved before bids are opened.
New suppliers may receive trial quantities with enhanced inspection. Strategic suppliers may receive a base allocation while competing for additional volume. Poor performance should have a documented consequence.
Sales and customer strategy
Sales commitments should be aligned with procurement and logistics. Fixed-price sales against floating purchases create risk, while destination commitments can become unprofitable if freight rates change. Contracts should reflect the organization’s ability to source and deliver.
Investment and capability decisions
Persistent logistics or quality constraints may justify investment in storage, bagging, blending, terminals, laboratory capability, or digital monitoring. The business case should compare capital cost with avoided demurrage, lost sales, inventory reduction, and resilience.
Decision record template
- Business requirement and deadline.
- Options considered and normalized landed cost.
- Key risks, scenarios, and triggers.
- Selected action, owner, and approvals.
- Expected cash and margin effect.
- Review date and actual outcome.
Final management perspective
The fertilizer and petrochemical markets covered in this report face structural volatility because energy, agriculture, policy, and maritime trade interact. The organization cannot control these drivers, but it can control data quality, portfolio design, contract clarity, inventory discipline, and response speed.
22. Product-Specific Procurement Strategies
Urea strategy
Urea procurement should balance tender-driven global volatility with broad availability of origins. Qualified term suppliers can cover base requirements, while the buyer staggers seasonal or customer-linked volume across shipment windows. Evaluate Persian Gulf offers based on route execution, while comparing Atlantic and Chinese alternatives on a normalized delivered-value basis.
The buyer should track granular versus prilled specification, agricultural versus industrial requirements, parcel size, and destination. A low FOB price is not preferable when freight costs, delays, or quality issues increase the expected cost. The coverage bands should reflect India’s tender pace, the Persian Gulf transit position, and Brazil’s demand scenarios.
Ammonia strategy
Ammonia requires terminal and vessel compatibility, making supplier substitution slower than for dry bulk. Procurement should secure a reliable core schedule and maintain technically qualified alternatives. Contract formulas should match the relevant regional benchmark and freight basis.
Outage response plans should include inventory, substitute downstream feedstocks where technically possible, terminal slots, and gas-carrier availability. Contract low-carbon ammonia under a separate certification and carbon-intensity framework.
Sulphur strategy
Tie sulfur coverage to the criticality of downstream plants. A phosphate producer may accept higher inventory costs to avoid a shutdown. Supplier diversification should span the Persian Gulf and alternative origins where quality and freight permit. The company may need to secure freight capacity with the commodity rather than afterward.
DAP, MAP and phosphate strategy
Phosphate procurement should monitor sulfur, ammonia, and destination demand rather than rely only on the finished benchmark. India-linked DAP and Brazil-linked MAP require different timing and commercial structures. Buyers should qualify Morocco, the Persian Gulf, China, and other origins according to specifications and routes.
Potash strategy
Independent purchasing recommendation: set potash coverage from confirmed needs, delivery lead time, and storage, not assumed global stability. Manage MOP and SOP separately, and confirm Canadian, Russian, or Belarusian offers against the actual specification, route, and counterparty acceptance before allocating.
Price-sensitive negotiations should use licensed benchmarks. Public producer guidance can support the market view but is not a substitute for exact spot evidence. Buyers should avoid building inventory solely because annual demand is forecast to grow.
NPK and methanol strategy
Purchase NPK based on verified formula, quality, and cost per usable nutrient. Where blending capability exists, compare finished imports with local manufacture using current, publicly supportable input context and executable supplier offers. Seasonal delivery, bag integrity, and caking risk affect the economic quantity.
Methanol procurement should separate posted reference, discount, freight, and realized landed cost, applying the same contract-versus-spot discipline used for ammonia given the two products’ shared feedstock exposure. Confirm terminal compatibility, tank availability, previous cargo, and safety documents. Currency risk is material when formulas use European or local references.
23. Route and Logistics Reference Guide
Persian Gulf to Asia
Confirm product-compatible tonnage, load-port readiness, and receiving-terminal capacity before evaluating freight. Indian tender-linked deliveries require separate shipment and inspection requirements; other Asian destinations may have different parcel and documentation needs. Use actual laycan, payment, and route terms for the cargo rather than a generic Persian Gulf freight assumption.
Persian Gulf to Europe and the Americas
Longer routes make delivery timing, insurance, funding, and destination readiness particularly material. Evaluate the nominated route and feasible alternatives with total voyage and inland cost. Obtain current operational and compliance acceptance before fixture. This reference guide describes decision inputs; it does not publish an unlicensed September freight assessment or imply that a specific corridor is currently open or closed.
North Africa and Mediterranean routes
North African nitrogen and phosphate producers retain relatively direct access to Mediterranean and European markets, along with competitive Atlantic routings for cargoes moving further afield. Port performance, parcel size, and product programs continue to shape actual availability more than published capacity figures. Morocco’s sulfur imports and phosphate exports remain a two-way bulk logistics flow that should be planned as a single system rather than two independent trades, since backhaul economics on both legs affect the freight quoted for either.
Mediterranean routes can provide alternatives when another corridor is disrupted, but port congestion, seasonal vessel demand and inland constraints must be monitored together. A routing that avoids one bottleneck can still face another further down the supply chain.
Baltic and Black Sea routes
Commercial advantages on these routes must still be adjusted for sanctions exposure, banking-chain acceptance, insurer willingness, vessel ownership, and physical security considerations that can change with limited notice. Documentation and payment-chain confirmation should occur before finalizing a fixture, not after; route or port substitution after contract signature can alter duty treatment, sanctions analysis, and freight responsibility in ways that are difficult and costly to unwind once cargo is loaded.
Canada and the Pacific
Canadian potash and sulfur exports depend on rail transport to coastal export terminals and then on long-haul ocean routes to Asia or Latin America. Mine output, railcar availability, terminal storage capacity, weather, and wildfire risk are all linked, and a purely inland disruption can affect ocean delivery schedules even when the vessel market itself is fully available.
Buyers should track actual rail and terminal performance alongside annual producer guidance, since the two frequently diverge during periods of weather stress or labor disruption. For critical delivery windows, maintaining an alternative terminal or origin capability carries strategic value that is difficult to quantify in a single freight comparison but material in a supply-continuity assessment.
Destination-port readiness
Logistics plans should account for holiday calendars, seasonal weather windows, port congestion trends, document cutoff times, and emergency contact chains for every active route. Destination-side failures can erase savings from careful commodity and freight negotiation; in the current environment, a well-negotiated cargo that queues two additional weeks at a congested discharge port can end up costing more than a slightly higher-priced cargo delivered on schedule.
Route comparison checklist
- Named loading and discharge ports, not only regions.
- Product, parcel size, and compatible vessel class.
- Expected sailing time and named route alternatives, including Cape and Panama contingencies.
- Vessel flag, beneficial ownership, and insurer acceptance for the specific routing.
- Port costs, expected waiting times, and demurrage terms, adjusted for current congestion risk.
- Inland leg cost and capacity, where barge or rail movement follows the ocean leg.
- Banking, sanctions, and documentation requirements confirmed before fixture.
- Probability of on-time delivery to the business need date, not only to the nominal laycan.
24. Financial KPIs and Performance Measurement
Procurement KPIs
Measure normalized landed cost against the approved comparison set, supplier on-time performance, quality acceptance, and adherence to coverage policy. A saving should use comparable grade, quantity, date, and delivery terms. Track exceptions and the reason for them. Avoid presenting a difference against a historical monthly benchmark as a realized purchasing saving.
Logistics KPIs
A lower freight rate that increases demurrage or late-delivery losses is not an improvement and should not be reported as one. Always evaluate total logistics cost and service level together, presenting the freight KPI and the on-time-delivery KPI side by side rather than in isolation.
Inventory KPIs
Track usable days of cover, committed and uncommitted stock, aging, storage utilization, quality holds and in-transit reliability by product. The denominator for cover should be a documented consumption or sales plan. Report stock that cannot be used or delivered separately, because a total tonnage figure can conceal a critical shortage.
Margin and working-capital KPIs
Report realized gross margin, replacement margin, cash tied up by cargo, receivable days, and financing cost. Explain the effect of product price, freight, quality claims, and foreign exchange separately. Reconcile commercial estimates with finance records after settlement, and distinguish accounting inventory movements from cash generated by trading.
Risk and control KPIs
Risk metrics include volume sourced from top origins and suppliers, unhedged foreign-exchange exposure, uninsured cargo exposure, sanctions-screening exceptions, overdue claims, red-level alerts, and unresolved control actions. A risk KPI should trigger ownership and review, not remain a passive descriptive figure sitting in a report that nobody is required to act on.
Balanced scorecard
A balanced commercial scorecard should combine cost, service, quality, cash, and risk into a single management view. Overweighting cost alone encourages fragile decisions — for example, selecting the cheapest available Persian Gulf-origin freight without regard to the delivery-probability gap documented in this report’s route guide. Overweighting security alone can create excess inventory and erode margins. Management should approve explicit weights based on strategy and each product line's criticality, and revisit those weights when conditions change materially.
25. Ninety-Day Implementation Plan
Objective: Convert the report into an operating rhythm with defined owners, data, thresholds, and decisions.
Days 1–15: Establish the baseline
Create a complete map of open purchases, sales, inventory, and transit by product, supplier, origin, route, bank, and insurer. Confirm units and Incoterms across every open position. Identify all unverified data currently used in recurring reports and replace it with controlled sources or explicit, labeled assumptions.
Days 16–30: define policy and triggers
Approve product-specific coverage bands, supplier concentration limits, and decision rights. Define green, amber, and red triggers for price, freight, inventory, and route risk, calibrated to current executable evidence rather than unsupported historical assumptions.
Standardize bid sheets, offer-normalization models, and contract checklists so you can compare Persian Gulf-origin, North African, Baltic, Black Sea, and Canadian offers on a genuinely equivalent landed-cost basis, including the freight premiums and inland-leg costs documented in the route guide. Confirm who can approve routing deviations, additional insurance, alternate ports, and emergency purchases, and ensure that authority is exercised without requiring senior management to reconvene for every decision.
Days 31–60: diversify and test
Independent implementation plan: qualify alternative suppliers and routes for the most critical products, test specifications and receiving compatibility, and complete an offer-normalization exercise using current quotations. Run a delayed-arrival and payment-disruption scenario. Resolve gaps in authority, documentation and liquidity before expanding volume, and record the outcome in the supplier and route registers.
Days 61–90: institutionalize
Launch a cross-functional market and risk review that integrates procurement, logistics, inventory, finance, quality and compliance KPIs. Revisit named chokepoints, alternative routes and inland dependencies on a defined schedule using current official and commercial evidence.
Complete supplier scorecards and allocate future volume in line with performance and the concentration policy approved in days 16–30. Approve the long-term capability roadmap for storage, laboratory testing, digital monitoring, or logistics partnerships needed to reduce dependence on any single corridor identified as a recurring point of failure.
Required deliverables
- Controlled market-data register and source archive.
- Product coverage and inventory policy.
- Supplier, origin, and corridor concentration map, with named chokepoint exposure by product.
- Standard tender, contract, and landed-cost templates that incorporate route-specific freight and inland-leg premiums.
- Risk register with owners and residual scores.
- Early-warning dashboard with trigger definitions calibrated to current conditions.
- Quarterly supplier scorecard and incident review process.
- Management decision record and action tracker.
Success criteria
The plan succeeds when management can state, for every critical product, how much is truly available, what is arriving, which risks can stop delivery, and what action each risk level triggers. Commercial offers should be comparable on a controlled landed-cost basis that reflects current freight and routing conditions, and exceptions—including chokepoint-driven ones—should be visible before commitment rather than discovered after cargo is already loaded.
Success is also measured by behavior: fewer emergency purchases, clearer contracts, faster claims, lower avoidable demurrage, disciplined inventory, and documented decisions. Keep the framework practical throughout; simplify or remove any indicator or approval step that does not meaningfully influence a decision.
Beyond ninety days
After initial implementation, refine thresholds using actual outcomes observed through the remainder of 2026, expand qualified supplier and route alternatives, and integrate the reporting rhythm with financial planning. Annual strategy should revisit storage, logistics, finance, and data investment using documented corridor-level experience.
Appendix A. Complete Sources & References
We reviewed sources on 3 October 2026. Public links may change; in particular, the USDA mnreports address is a rolling report URL. Confirm the 18 September 2026 header before comparing its values with this edition. Publisher availability does not grant permission to reproduce its prose, graphics or licensed third-party assessments. The original charts here use selected public facts and independent arithmetic.
S1 USDA Pacific Northwest Production Cost Report
18 September 2026 observation; FOB distributor asks. Supplies the selected nitrogen, MAP, MOP, and NPK panel. Original graphics are not reproduced. Open public source
S1a USDA report description and archive access
Publisher’s description of the production-cost report and market basis. Use the archive to retrieve the dated edition if the rolling PDF changes. Open public source
S2 Methanex September valid price sheet
Sheet dated 28 August; USD references valid 1–30 September 2026. Supports September methanol values, not spot realizations. Open public source
S3 Methanex posted pricing
October validity; Asia Pacific and China posted 25 September, North America posted 29 September. Supports forward reset only. Open public source
S4 EIA September Short-Term Energy Outlook
Released 9 September; annual Henry Hub forecasts on PDF page 3. Government forecast, not a monthly actual or supplier contract. Open public source
S5 KBR ammonia technology announcement
29 September; 1.2 million metric tons/year planned ammonia and urea capacity from 4.8 to 7.4 million metric tons/year. No current supply inference. Open public source
S6 Samsung EPC project announcement
11 September: confirms project execution, 2030 completion horizon, and carbon capture integration. No lifecycle-emissions certification inferred. Open public source
S7 Government NFL procurement listing
14 September: DAP import notice, NFL/CO/SC/2026-27/DAP/04, tender ID 2026_NFL_290742_1. Supports the notice, not an award. This organization listing is dynamic; search the stated tender ID if it moves. Open public source
S8 PGQ explanation of USDA price units
Unit convention only: USD per metric ton after quantity normalization. Its price summary is not used for the numerical panel. Open public source
Numerical traceability and calculation rules
Every USDA price uses the same metric conversion divisor, 0.90718474. Eight clear product rows are retained; calcium nitrate and liquid-volume quotations are excluded. Published averages are preserved, not recalculated as range midpoints. No volume-weighted average is claimed.
Nitrogen-only cost divides converted price by the assumed label nitrogen fraction. The NPK screen divides the converted product price by the sum of the N, P2O5, and K2O label fractions. Methanol reset percentages use October posted metric-ton value divided by September posted metric-ton value, minus one. Capacity increase uses 7.4 minus 4.8 and divides that increment by 4.8. All derived quantities are Green Gubre Group calculations, not new publisher assessments.
Publication scope and unresolved data gaps
This is a September public-source market and purchasing review, not a complete licensed global price service. Regional ammonia and elemental-sulfur curves, freight histories, country import totals, September production rates and plant margins remain outside the verified evidence assembled. The report does not certify every external source as error-free. These limits apply to the relevant chapters and should remain visible if content is excerpted for a website or presentation.
Appendix B. Market Conventions and Glossary
Pricing and delivery terms
| Term | Meaning |
|---|---|
| FOB | Free on Board: seller delivers cargo on board at the named port of loading; ocean freight is normally the buyer’s responsibility. |
| CFR | Cost and Freight: seller pays ocean freight to the named destination; cargo insurance is normally the buyer’s responsibility. |
| CIF | Cost, Insurance and Freight: seller pays freight and minimum cargo insurance to the named destination. |
| FCA | Free Carrier: seller delivers goods to a carrier or other party nominated by the buyer at a named place. |
| Netback | Estimated value at origin after deducting freight and other delivery costs from a destination value. |
| Spot | Transaction or assessment for prompt/near-term delivery rather than a long-term contract. |
| Posted price | A published reference price that may differ from realized prices after discounts and contract terms. |
Product abbreviations
| Abbreviation | Definition |
|---|---|
| AN | Ammonium nitrate |
| CAN | Calcium ammonium nitrate |
| UAN | Urea ammonium nitrate solution |
| DAP | Diammonium phosphate |
| MAP | Monoammonium phosphate |
| MOP | Muriate of potash/potassium chloride |
| SOP | Sulfate of potash/potassium sulfate |
| NPK | Compound fertilizer containing nitrogen, phosphorus and potassium |
| HPAL | High-pressure acid leach (a nickel-processing route that consumes sulfuric acid) |
Units and comparison rules
USD per metric ton means US dollars per 1,000 kilograms. Energy prices use USD/GJ. Asking, posted, contract, forecast and executed prices are distinct evidence classes. Ranges are reported low–high; dots indicate reported averages, not range midpoints. Different delivery points require an explicit cost bridge.