December 2025 Fertilizer&
Petrochemical Market Report
Green Gubre Group
Author: Saman Memarpour
Executive Summary
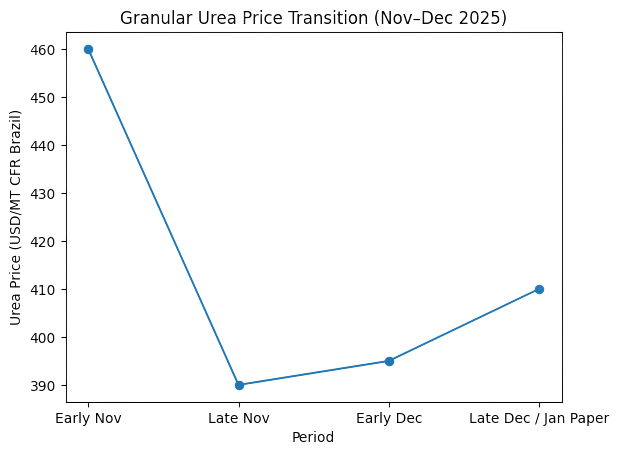
December 2025 marked a critical transition phase in global fertilizer and petrochemical markets, following the sharp, demand-driven correction that unfolded in November. While November was dominated by abrupt demand shocks—most notably India’s large urea tender, Brazil’s liquidity-driven withdrawal from spot markets, and the sudden re-emergence of Chinese exports—December unfolded as a month of price consolidation, structural rebalancing, and forward positioning rather than further capitulation. Across most fertilizer products, markets entered December under residual bearish pressure but exited the month with more evident signs that the downside momentum had largely been absorbed. This shift was most apparent in granular urea paper markets, where January pricing began to reprice higher despite continued caution in physical spot demand.
Reference:
World Bank – Commodity Markets Outlook
Market Phase Comparison – November vs December 2025
| Element | November 2025 | December 2025 | Strategic Meaning |
|---|---|---|---|
| Market driver | Demand shock | Structural rebalancing | Correction absorbed |
| Price behavior | Sharp declines | Range-bound, stabilizing | Floor formation |
| Buyer behavior | Liquidity withdrawal | Selective coverage | Risk normalization |
| Seller behavior | Forced discounting | Disciplined pricing | Netbacks defended |
| Market focus | Inventory clearance | Forward positioning | Netbacks defended |
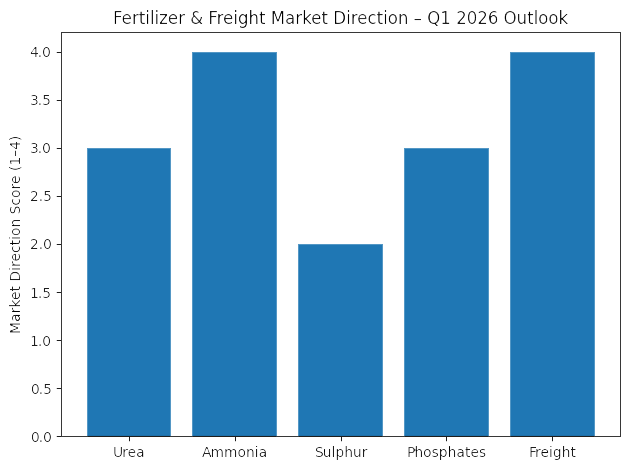
Within the nitrogen complex, December reinforced a divergent product structure that had begun to emerge in late November. Urea prices stabilized after weeks of decline and gradually moved higher into January, with front-month paper signaling that sellers were no longer forced to discount aggressively to clear prompt availability. Ammonia, by contrast, remained structurally tight throughout the month, supported by ongoing supply constraints, limited spot availability, and resilient downstream demand from both fertilizer and industrial sectors. Sulphur, which had experienced an exceptional rally through November, entered December at elevated levels but began to encounter demand resistance, particularly in Asia, as affordability constraints limited spot buying—signaling the early stages of a corrective phase. Phosphate markets remained comparatively soft; however, the pace of decline slowed as importers shifted from outright deferral toward cautious, hand-to-mouth coverage in anticipation of Q1 seasonal demand.
Reference: Trading Economics – Urea & Fertilizer Prices
Product-Level Positioning – December 2025 Snapshot
| Product | December Status | Dominant Driver | Market Signal |
|---|---|---|---|
| Urea | Stabilizing, forward-led | Demand timing & freight | Floor forming |
| Ammonia | Firm, low volatility | Supply constraints | Structural tightness |
| Sulphur | Peaking → correcting | Affordability limits | Normalization |
| Phosphates | Soft but stabilizing | Seasonal demand | Gradual recovery |
| Freight | Tight, price-supportive | Vessel availability | CFR floors |
Freight dynamics emerged as one of the most influential variables shaping market outcomes in December. Seasonal vessel tightness, sanctions-related premiums, and route-specific constraints materially altered landed cost economics, often overriding apparent FOB competitiveness. As a result, logistics costs transitioned from a secondary consideration into a structural pricing component, directly influencing trade feasibility and origin selection. This effect was particularly pronounced on flows into Brazil, India, Turkey, and the US Gulf, where freight spreads defined both price floors and ceilings during the month. In several cases, freight economics effectively limited further CFR price erosion despite weak underlying demand, reinforcing December’s broader theme of stabilization rather than continued decline.
Reference: Baltic Exchange – Freight Market Indicators

Structural Forces Defining December 2025
| Force | Impact on Market |
|---|---|
| Freight tightness | Prevented CFR breakdown |
| Supply discipline | Reduced forced selling |
| Forward paper pricing | Shifted focus to Q1 |
| Regional divergence | Broke synchronized decline |
| Cost support | Reinforced price floors |
Looking ahead, December closed with markets increasingly oriented toward January execution and Q1 2026 positioning, rather than backward-looking inventory clearance. While demand remains selective and highly price-sensitive, the month confirmed that the aggressive correction phase seen in November has largely run its course. Entering Q1 2026, market direction will be shaped by the timing and scale of India’s next demand signal, China’s export management strategy, Brazil’s purchasing confidence, and the persistence of freight tightness across key trade routes. In this environment, price volatility is expected to remain elevated, but within a more disciplined and structurally supported framework than during the November correction.
Reference: International Fertilizer Association (IFA) – Market Context
NITROGEN – UREA MARKET (December 2025)
Global Urea Price Overview
The global urea market entered December 2025 still anchored by the sharp correction that unfolded in November, with market participants approaching the month in a highly defensive posture. Buyers across major importing regions remained cautious following the abrupt re-pricing triggered by India’s November tender and Brazil’s sudden withdrawal from spot liquidity. At the same time, producers and traders focused primarily on defending reduced netbacks, rather than pushing volume, after FOB values had already adjusted materially lower. As a result, early December was characterized by low transactional liquidity, limited tender activity, and subdued spot demand across nearly all major CFR destinations.
Reference: Trading Economics – Urea Prices
Global Urea Market Conditions – Early December 2025
| Market Factor | December Condition | Market Impact |
|---|---|---|
| Buyer behavior | Defensive, risk-averse | Low spot activity |
| Seller strategy | Margin protection | Limited discounting |
| Tender activity | Minimal | Weak price discovery |
| Spot liquidity | Thin | Prices stabilize |
| Market sentiment | Bearish → Neutral | Correction losing momentum |
Despite this muted demand environment, December differed fundamentally from November, as prices stopped falling across most benchmarks. FOB values in the Middle East, North Africa, and the Black Sea, as well as CFR prices into Brazil, India, and the United States, stabilized within relatively narrow ranges. This stabilization indicated that the market had absorbed mainly the November shock and that incremental selling pressure had diminished. Sellers were no longer forced to discount aggressively to clear prompt availability. At the same time, buyers—although still cautious—began to recognize that further downside was becoming increasingly limited without a new demand-side catalyst.
Reference: International Fertilizer Association (IFA) – Fertilizer Market Context
Directional Price Behavior – November vs December
| Region / Benchmark | November Trend | December Trend | Interpretation |
|---|---|---|---|
| Middle East FOB | ↓ Sharp decline | → Stabilizing | Netbacks defended |
| Egypt FOB | ↑ then ↓ | → Stable | Europe support |
| Brazil CFR | ↓ Steep | → Flat | Liquidity constrained |
| India CFR | ↓ Reset by tender | → Anchored | Ceiling remains |
| US Gulf FOB | ↓ Persistent | ↑ Late-month | Inventory clearing |
Reference: FAO – Fertilizer Statistics Database
A defining feature of December was the clear roll from December pricing into higher January and front-month paper values, particularly visible in granular urea assessments. This transition reflected a meaningful shift in market psychology. Instead of focusing on clearing remaining December inventory at discounted levels, both buyers and sellers began to orient pricing toward Q1 availability. Such behavior is typically observed when a corrective phase is approaching exhaustion: market participants accept that the bulk of the downside adjustment has already occurred and begin repositioning for future demand rather than chasing spot bargains.
Reference:
ICIS – Fertilizer Market Updates
Paper Market Signal – December to January Transition
| Pricing Focus | Market Behavior | Signal |
|---|---|---|
| December prompt | Defensive | Clearing phase |
| January paper | Higher values | Forward positioning |
| Seller behavior | Less flexible | Downside limited |
| Buyer behavior | Selective coverage | Floor forming |
Reference: ICIS – Fertilizer Market Updates
This paper-led re-pricing did not imply a sudden recovery in physical demand. Instead, it signaled a
rebalancing of expectations. Importers remained selective and price-sensitive, but the willingness to wait indefinitely for lower prices diminished as freight tightened, sellers limited downside flexibility, and January loading windows began to fill. In this context, December marked a transition from a
disorderly correction toward a
more structured and disciplined pricing environment, setting the stage for heightened volatility—but within more explicit bounds—heading into Q1 2026.
Reference: World Bank – Commodity Markets Outlook
Consolidated Granular Urea Paper Benchmarks (USD/MT)
Paper market indicators in December 2025 clearly illustrate the market’s transition from post-correction stabilization to forward-looking price discovery. Unlike November—when benchmarks adjusted sharply lower in response to demand shocks—December pricing behavior was defined by range formation early in the month and selective repricing into January/front-month paper by mid-to-late December.
The following consolidated benchmarks summarize this evolution across the most influential global reference markets.
Consolidated Granular Urea Paper Benchmarks – December 2025
| Region / Benchmark | Early Dec (Dec paper) | Late Dec / Jan paper | Direction | Market Signal |
|---|---|---|---|---|
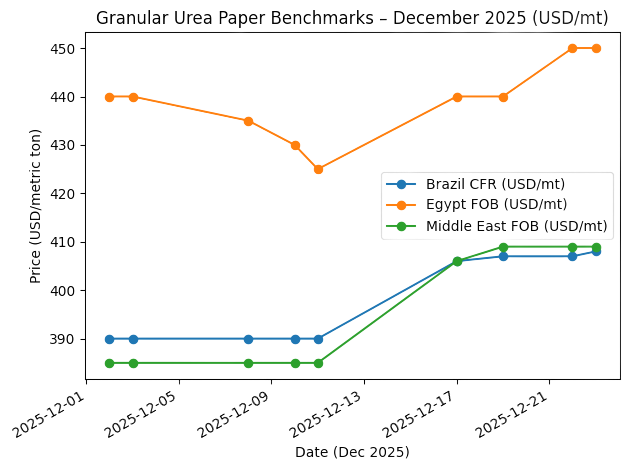
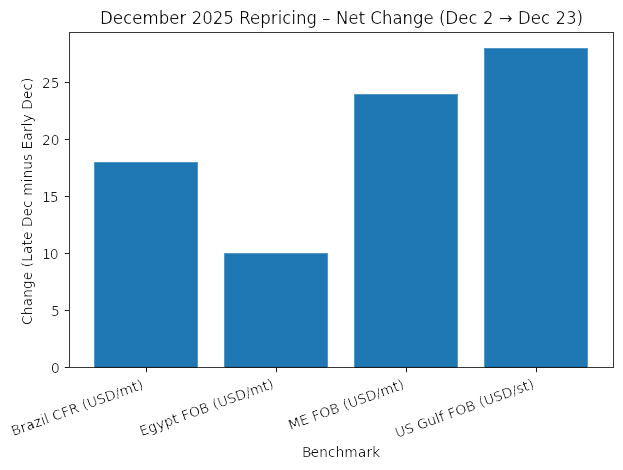
| Brazil CFR | ~USD 390 | USD 406–408 | ↑ | Brazil stabilizes; forward pricing improves despite weak spot demand |
| Egypt FOB (Europe) | USD 425–440 | USD 440–450 | ↑ | Europe-supported premium re-emerges |
| Middle East FOB | ~USD 385 | USD 406–409 | ↑ | Clear January re-pricing; downside exhaustion |
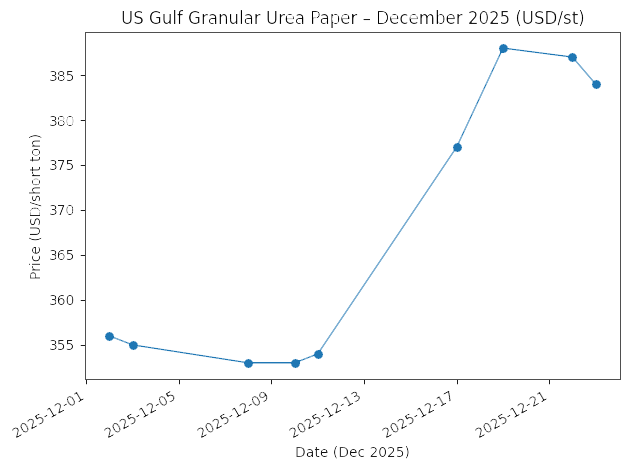
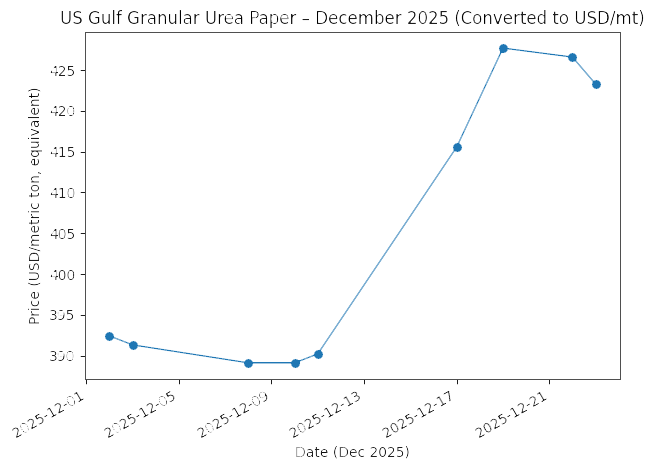
| US Gulf FOB (USD/st) | USD 353–356 | USD 377–388 | ↑ | Strongest rebound signal among major benchmarks |
Reference: FAO – Fertilizer Statistics Database
Pricing Phase Comparison – December 2025
| Market | Early December Behavior | Late Dec / Jan Paper Behavior | Structural Interpretation |
|---|---|---|---|
| Brazil CFR | Flat at low levels, liquidity-driven | Higher January indications despite weak buying | Sellers resist sub-USD 400 CFR for Q1 deliveries |
| Middle East FOB | Defensive pricing, limited flexibility | Clear January re-pricing above December | Downside exhaustion; ME regains marginal pricing role |
| Egypt FOB (Europe) | Supported by Europe, range-bound | Premium re-established for forward months | Regional insulation from global weakness |
| US Gulf FOB | Depressed, inventory-clearing phase | Sharp rebound in January parity | Atlantic Basin stabilization signal |
Reference: FAO – Fertilizer Statistics Database
Market Interpretation – What the December Transition Actually Signals
The December transition from prompt pricing to January paper values does not reflect a sudden improvement in end-user demand. Instead, it highlights a shift in pricing mechanics:
- Prompt oversupply pressure eased after November’s correction
- Sellers regained leverage as downside flexibility diminished.
- Freight and timing constraints became more influential than spot bids.
- Forward availability, not distressed liquidation, began to define price discovery.
The strongest signals emerged from the US Gulf and Middle East FOB benchmarks, where January paper pricing moved materially higher despite continued caution in physical buying. Historically, this pattern indicates that the market is transitioning from a correction phase into a range-bound, structurally supported environment, rather than entering a new bullish cycle.
Reference: World Bank – Commodity Markets Outlook
Regional Interpretation & Market Logic
Brazil CFR
Brazil’s CFR benchmark stabilized first, reflecting its role as the global “stress test” market. Early December values near USD 390 indicated severe demand caution; however, the late-month move into USD 406–408 on January paper suggests that sellers and traders no longer viewed sub-USD 400 CFR as sustainable for Q1 deliveries, even in a liquidity-constrained environment.
Reference: Trading Economics – Urea Prices
Egypt FOB (Europe)
Egypt maintained a structural premium throughout December due to European demand continuity ahead of CBAM implementation. The gradual firming to USD 440–450 FOB confirmed that Europe remained insulated from the broader bearish tone in the Americas, reinforcing regional divergence in the global urea market.
Reference: International Fertilizer Association (IFA) – Market Context
Middle East FOB
The Middle East FOB paper showed one of the most evident signs that the November correction had run its course. The transition from ~USD 385 to above USD 405 on the January paper reflected both disciplined selling behavior and improved freight-adjusted netbacks. This shift effectively re-established the Middle East as the marginal price setter for early Q1 trade flows.
Reference: ICIS – Fertilizer Market Updates
US Gulf FOB
The US Gulf benchmark delivered the strongest rebound signal during December. After bottoming in early December, prices recovered sharply into the high-USD 370s and upper-USD 380s, reflecting inventory drawdown, improved export parity, and tightening logistics. Historically, such a move often precedes broader stabilization across Atlantic Basin markets.
Reference: USDA AMS – Fertilizer Market Reports
Market Conclusion from Paper Benchmarks
Taken together, these papers' benchmarks confirm that December 2025 marked a shift in price discovery from distressed spot liquidation toward forward availability pricing. While physical demand remained cautious and highly selective, the collective move into higher January paper values indicates that the market increasingly accepted that the bulk of the corrective adjustment had already occurred.
Rather than signaling an outright recovery, this pattern points to a price floor formation process, setting the stage for higher volatility—but within more explicit structural bounds—heading into Q1 2026.
Reference: World Bank – Commodity Markets Outlook
Regional Market Insights
Middle East (Persian Gulf)
The Middle East urea market entered December in a clearly defensive posture, reflecting the sharp netback compression experienced during November. Producers prioritized price discipline over volume generation, recognizing that aggressive discounting would further erode margins without meaningfully stimulating demand. FOB values in the mid-USD 380s during early December reflected weak spot demand, but also an explicit unwillingness on the part of sellers to push prices materially lower after the November correction had already reset global benchmarks.
Reference: International Fertilizer Association (IFA) – Market Context
)By mid-to-late December, the regional market experienced a notablere-pricing on January paper, with indications moving decisively into the low-USD 400s. This shift was driven by a combination of improved freight feasibility into key destinations, reduced competitive pressure from Chinese spot exports, and growing confidence among sellers that the downside phase had largely been exhausted. Rather than acting as a source of continued bearish pressure, the Middle East ended December as a
stabilizing origin, reasserting its role as the marginal price reference for early Q1 trade flows.
Reference: ICIS – Fertilizer Market Updates
Egypt FOB (Europe)
Egyptian FOB values remained structurally supported throughout December, underpinned by sustained European demand ahead of the implementation of the Carbon Border Adjustment Mechanism (CBAM). Although early December saw some easing from November’s extreme highs, Egypt continued to command a premium versus most other exporting origins due to proximity advantages, reliable logistics, and Europe’s willingness to pay for secure supply windows.
Reference: European Commission – Carbon Border Adjustment Mechanism (CBAM)
Late December pricing strengthened into the USD 440–450 FOB range as European buyers finalized year-end and early-January coverage. This firming reinforced theregional divergence that defined December trading. While markets in the Americas remained liquidity-constrained, Europe emerged as the strongest and most resilient demand center within the global urea complex. Egypt’s performance during the month highlighted Europe’s continued insulation from broader global softness.
Reference: International Fertilizer Association (IFA) – European Fertilizer Market Context
Brazil CF
Brazil remained the weakest major demand center during December 2025, but the pace of decline slowed markedly compared with November. Early-month CFR values stabilized near USD 390, reflecting cautious importer behavior driven by currency depreciation, elevated inventories, and high financing costs. Importers largely refrained from building long positions, preferring to monitor global developments rather than commit to spot purchases.
Reference: Trading Economics – Brazil Currency (BRL)
RBy late December, CFR indications improved modestly into the low-USD 400s on January pricing. This improvement was driven primarily by global stabilization and forward re-pricing rather than a resurgence in Brazilian buying appetite. Brazil exited Decemberflat but more balanced, retaining its strategic role as a potential ceiling-setter for global prices should liquidity weaken again in early Q1 2026.
Reference: FAO – Fertilizer Statistics Database
United States (US Gulf)
The US Gulf urea market delivered one of the clearest recovery signals during December. After beginning the month near USD 350–355/st—levels associated with inventory liquidation and weak domestic pull—prices strengthened steadily into the high-USD 370s and upper-USD 380s by late December.
Reference: USDA Agricultural Marketing Service – Fertilizer Market Reports
This rebound reflected inventory cleanup at coastal terminals, seasonal logistics constraints, and improving export parity relative to Brazil. As a result, the US Gulf transitioned from being a global drag on sentiment to astabilizing Atlantic Basin benchmark, often a precursor to broader regional normalization.
Reference: ICIS – Fertilizer Market Updates
Comparative Regional Positioning – December 2025
| Region | Early December Position | Late December Position | Structural Role |
|---|---|---|---|
| Middle East FOB | Defensive, margin-focused | January re-pricing | Global price stabilizer |
| Egypt FOB (Europe) | Premium softening | Premium re-established | Europe-driven strength |
| Brazil CFR | Liquidity-constrained | Flat-to-firmer | Global ceiling risk |
| US Gulf FOB | Inventory liquidation | Strong rebound | Atlantic Basin stabilizer |
Reference: FAO – Fertilizer Statistics Database
Regional Conclusion
December’s regional price behavior confirmed that the global urea market was no longer moving in a synchronized bearish pattern. Instead, regional divergence became more pronounced, with Europe and the Middle East stabilizing first, the US Gulf rebounding late, and Brazil remaining cautious but less destabilizing than in November. This divergence reinforces the view that the market has transitioned into a range-bound, structurally supported phase, rather than entering a renewed correction.
Reference: World Bank – Commodity Markets Outlook
AMMONIA MARKET (December 2025)
Market Overview
Ammonia remained the strongest and most structurally resilient nitrogen product throughout December 2025, further widening the divergence between ammonia and urea markets that first became evident in November. While urea prices entered a stabilization and forward-repricing phase after a demand-driven correction, ammonia markets remained supply-led, supported by persistent availability constraints and firm downstream consumption. As a result, ammonia prices remained elevated, with minimal volatility, largely insulated from the broader nitrogen market's softness.
Reference: ICIS – Ammonia Market Overview
The defining characteristic of the ammonia market in December was the
absence of adequate demand elasticity. Unlike urea—where buyers can defer purchases or draw down inventories—ammonia consumers, particularly phosphate producers and industrial users, operate with limited substitution options and lower inventory flexibility. This structural feature meant that even as global fertilizer sentiment remained cautious, ammonia buyers were compelled to maintain coverage, reinforcing price stability across regions.
Reference: International Fertilizer Association (IFA) – Nitrogen Fertilizer Market Context
Global Ammonia Supply Structure – December 2025
| Supply Factor | Status | Market Implication |
|---|---|---|
| Major plant outages | Prolonged | Reduced global availability |
| Spot cargo availability | Very limited | Price rigidity |
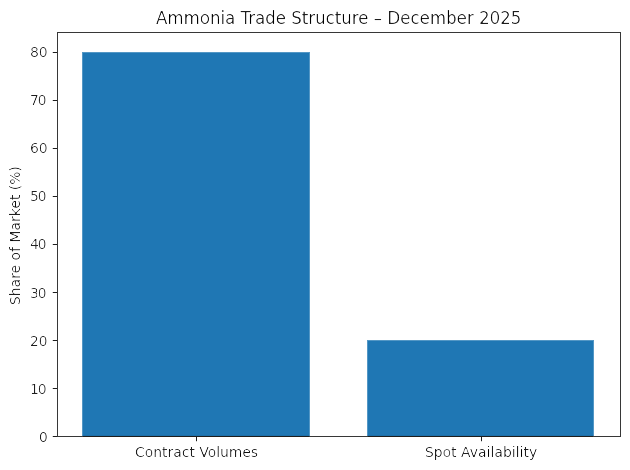
| Contract coverage | High | Low volatility |
| Restart visibility | Delayed | Tightness extends |
| Export discipline | Strong | FOB prices supported |
Reference: ICIS – Ammonia Supply & Operations Updates
Production disruptions continued to constrain supply during December, limiting the volume of uncommitted ammonia available to the spot market. As a result, contractual trade dominated price formation, reducing the influence of opportunistic buying or short-term sentiment shifts. This structural tightness was particularly evident in the Atlantic Basin, where limited availability into Europe and the US Gulf reinforced elevated CFR benchmarks despite subdued activity elsewhere in the fertilizer complex.
Reference:
World Bank – Commodity Markets Outlook
Key Ammonia Price Benchmarks – December 2025
| Region | Typical Price Level | December Trend | Structural Driver |
|---|---|---|---|
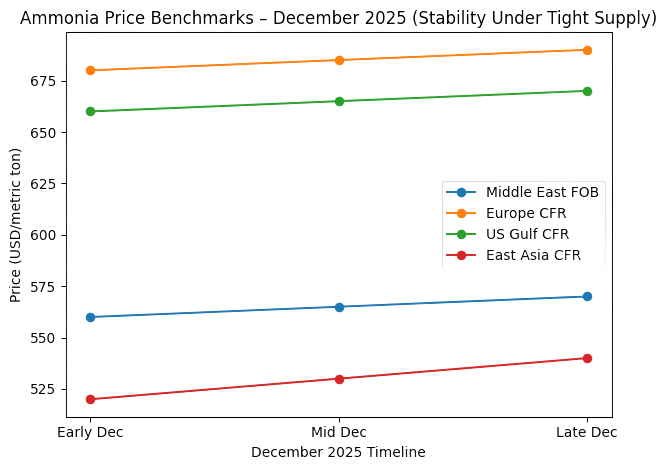
| Middle East FOB | High USD 500s | → Firm | Limited export availability |
| Europe CFR | High USD 600s | → Stable | Contract-dominated imports |
| US Gulf CFR | Mid–High USD 600s | → Stable | Supply tightness |
| East Asia CFR | Low–Mid USD 500s | ↑ Slight | Import dependence |
Reference: World Bank – Commodity Markets Outlook
Middle East FOB ammonia remained firm throughout December as producers faced no commercial incentive to discount. With firm contractual commitments and steady downstream demand from phosphate producers, Middle Eastern suppliers maintained disciplined export strategies. The absence of excess spot volumes kept FOB values elevated, reinforcing the region’s role as a key stabilizing origin in the global ammonia trade.
Reference: ICIS – Ammonia Market Updates
In Europe, ammonia prices remained stable despite broader softness in the fertilizer market. Importers prioritized security of supply over price optimization, particularly given the limited availability of spot cargoes and the high operational dependence of European downstream industries on ammonia feedstock. As a result, December saw minimal spot trading, with prices anchored by long-term contractual frameworks.
Reference:
International Fertilizer Association (IFA) – European Nitrogen Market Context
Similarly, the US Gulf ammonia market remained firm throughout December—tight domestic availability, combined with constrained imports and steady industrial demand, limited downside risk. Unlike urea, where inventories and weather can rapidly alter demand patterns, ammonia demand in the US Gulf remained structurally inelastic, reinforcing price stability into year-end.
Reference: ICIS – US Ammonia Market Analysis
Downstream Demand Support – December 2025
| Sector | Demand Trend | Impact on Ammonia |
|---|---|---|
| Phosphate fertilizers (DAP/MAP) | Strong | Sustained consumption |
| Industrial chemicals | Stable | Base-load demand |
| Caprolactam / AN | Firm | Limited substitution |
| Energy-linked industries | Stable | Price-insensitive demand |
Outlook
Ammonia is expected to remain firm through January 2026, as none of the structural tightness drivers are expected to ease meaningfully in the near term. Contract coverage will continue to dominate trade flows, while spot availability is likely to remain constrained. As a result, price volatility is expected to stay low relative to other nitrogen products.
Reference: World Bank – Commodity Markets Outlook
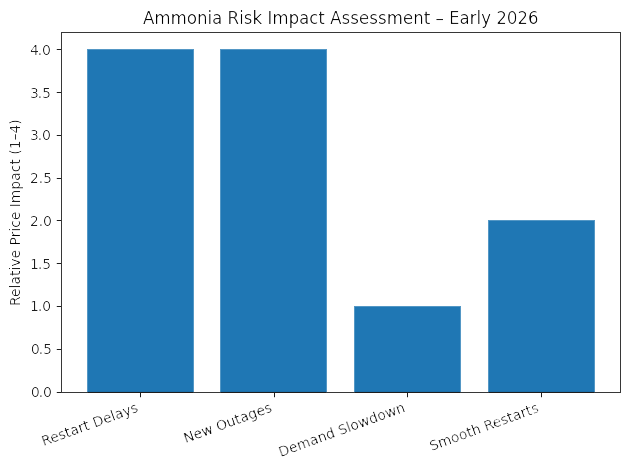
The first credible window for a correction is anticipated in February–March 2026, contingent on the successful restart of several ammonia production units and improved global availability. Should these restarts proceed as planned, spot liquidity would gradually improve, allowing prices to soften in a controlled and orderly manner. However, the risk profile remains asymmetric: any delays, technical issues, or new outages could extend tightness well into Q2 2026, prolonging elevated price levels beyond current expectations.
Reference: ICIS – Ammonia Supply Outlook
Ammonia Market Risk Matrix – Early 2026
| Risk Factor | Probability | Price Impact |
|---|---|---|
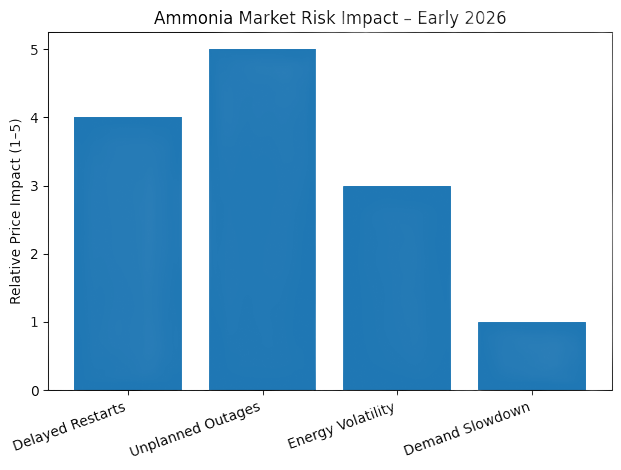
| Delayed plant restarts | Medium | Bullish |
| New unplanned outages | Low–Medium | Strongly bullish |
| Demand slowdown | Low | Mildly bearish |
| Energy price volatility | Medium | Volatile |
| Logistics disruptions | Low | Bullish |
Reference: World Bank – Commodity Risk Assessment
Ammonia Market Conclusion
In December 2025, ammonia’s role as the structural anchor of the nitrogen complex was reinforced. While urea transitioned into stabilization and forward repricing, ammonia remained supply-constrained, contract-driven, and largely immune to short-term sentiment shifts. This divergence underscores the importance of treating ammonia as a fundamentally different market—one where operational reliability and supply availability dominate price formation far more than spot demand dynamics.
Reference: International Fertilizer Association (IFA) – Nitrogen Market Context
SULPHUR MARKET (December 2025)
Market Dynamics
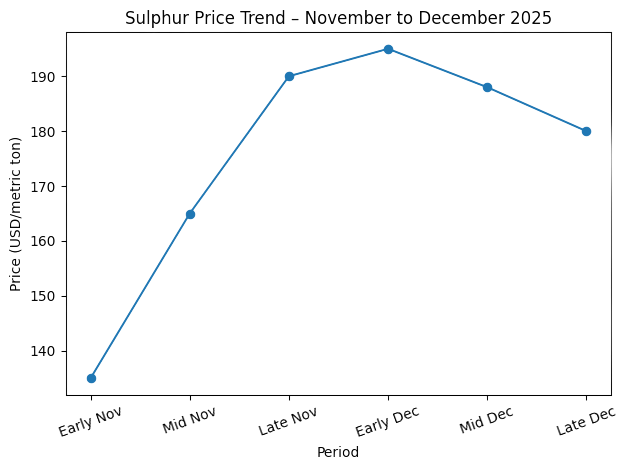
Sulphur entered December 2025 at historically elevated price levels, carrying strong bullish momentum from November’s rally. That rally was driven by a combination of tight supply, maintenance-related production constraints, and aggressive restocking by downstream consumers—particularly in the phosphate fertilizer chain. As a result, early December pricing remained elevated across key CFR destinations, with market sentiment still shaped by concerns over availability rather than immediate demand weakness.
Reference: Trading Economics – Sulphur Prices
As December progressed, however, the market began to exhibit
clear signs of demand resistance, marking a shift from supply-driven rally to affordability-driven reassessment. This was most evident in China, where elevated sulphur prices increasingly strained sulphuric acid margins and reduced buyers' willingness to chase spot cargoes at prevailing levels. Spot activity slowed, bid intensity weakened, and price momentum began to decelerate, even though underlying supply constraints had not entirely disappeared.
Reference: ICIS – Sulphur Market Updates
Sulphur Price Behavior – November vs December 2025
| Period | Market Phase | Price Behavior | Key Driver |
|---|---|---|---|
| November 2025 | Rally | Sharp upside | Supply tightness, restocking |
| Early December | Plateau | Elevated, stable | Lagged rally effect |
| Mid December | Resistance | Slower gains | Affordability constraints |
| Late December | Transition | Flat to softer | Demand pullback |
Reference: Trading Economics – Sulphur Prices
While supply remained constrained through much of December, incremental improvements on the supply side began to alter market expectations. The easing of some maintenance schedules and improved visibility on exports reduced immediate fears of severe shortages. This shift did not trigger a collapse in prices; instead, it signaled a transition from an aggressive rally phase to a corrective adjustment, in which price direction becomes increasingly sensitive to downstream demand rather than headline supply risks.
Reference: ICIS – Sulphur Market Commentary
Importantly, December did not mark a reversal of sulphur’s structural importance within the fertilizer complex. Phosphate producers continued to consume sulphur at steady rates, but their purchasing behavior became more selective. Buyers prioritized contract volumes and deferred discretionary spot purchases, reinforcing the idea that the market was entering anormalization phase, rather than experiencing a fundamental demand collapse.
Reference: FAO – Fertilizer Inputs & Phosphate Production Context
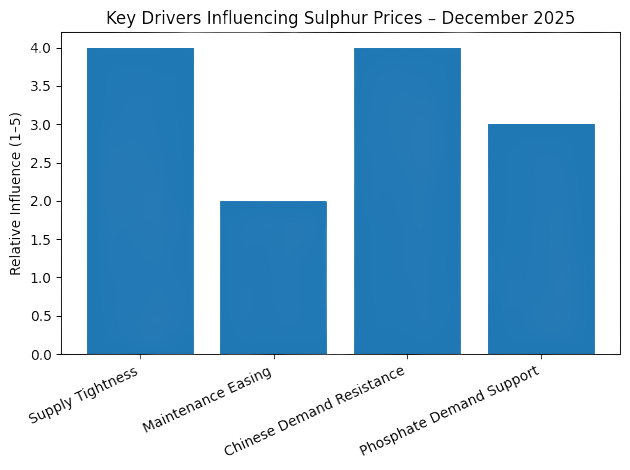
Key Drivers Shaping the December Sulphur Market
| Driver | December Status | Market Impact |
|---|---|---|
| Supply availability | Tight but improving | Limits downside |
| Maintenance schedules | Easing | Reduces panic buying |
| Chinese demand | Resistant | Caps upside |
| Acid margins | Compressed | Reduces spot bids |
| Phosphate demand | Stable | Structural support |
Reference:
FAO – Fertilizer Statistics Database
Outlook
Looking ahead, sulphur is expected to correct from peak levels during early Q1 2026, as the market fully digests the easing of supply constraints and adjusts to more disciplined downstream buying behavior. This correction is likely to be orderly rather than abrupt, reflecting the absence of an actual oversupply scenario and the continued importance of sulphur within the phosphate fertilizer value chain.
Reference: World Bank – Commodity Markets Outlook
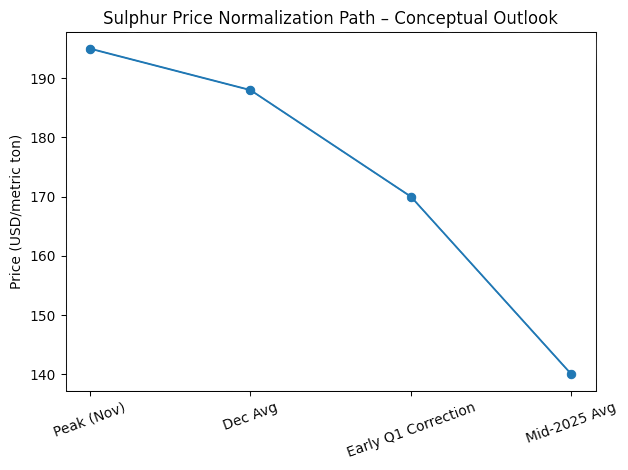
Despite the expected correction, sulphur prices are projected to remain structurally supported above mid-2025 averages. Ongoing phosphate production requirements, limited inventory flexibility, and the lingering fragility of global sulphur logistics are expected to prevent a return to pre-rally price levels in the near term. Volatility is therefore likely to remain elevated, particularly if demand from the phosphate sector accelerates or if new supply disruptions emerge.
Reference: FAO – Fertilizer Statistics & Input Costs
Sulphur Market Conclusio
December 2025 represented a pivot point for the sulphur market. The month marked the transition from a supply-driven rally to a demand-constrained normalization phase, in which affordability and downstream margins regained influence over price formation. While upside momentum has clearly slowed, the underlying market structure remains supportive, positioning sulphur for a controlled correction rather than a deep downturn as the market moves into Q1 2026.
Reference: ICIS – Sulphur Market Overview
PHOSPHATES MARKET (December 2025)
Market Overview
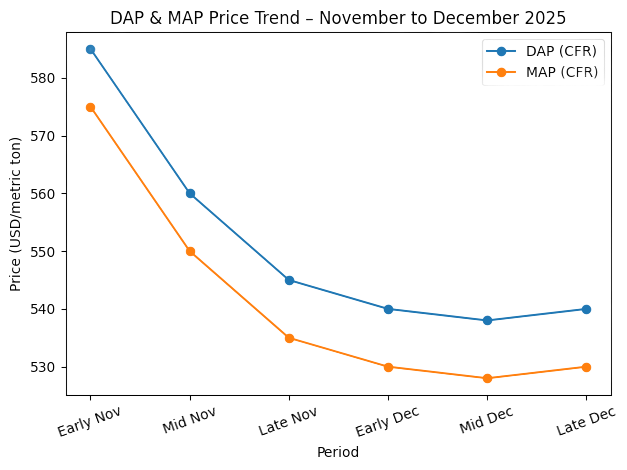
Phosphate fertilizer markets remained soft but increasingly stable throughout December 2025, suggesting a shift from the sharper downside momentum observed in November. While DAP and MAP prices continued to face pressure from cautious import demand and ample availability, the pace of decline slowed noticeably as buyers began reassessing coverage needs for early Q1 2026. Importers across key regions shifted from outright deferral to selective, near-term procurement, suggesting the market was approaching a short-term equilibrium rather than continuing a freefall.
Reference: FAO – Fertilizer Statistics Database
A key stabilizing factor during December was the
absence of aggressive supply-side disruption. Unlike nitrogen products—where tenders and outages can rapidly reset price expectations—the phosphate market remained governed by relatively predictable supply flows. China maintained a controlled export posture, limiting the risk of sudden volume surges, while stable supply from North Africa ensured that importers could meet baseline requirements without bidding prices higher. This balance prevented sharp price movements and kept DAP and MAP largely range-bound through the month.
Reference: ICIS – Phosphates Market Updates
Phosphate Market Behavior – November vs December 2025
| Factor | November 2025 | December 2025 | Market Implication |
|---|---|---|---|
| Price direction | Downward | Flat to soft | Downside momentum slows |
| Buyer behavior | Defensive, delayed | Selective coverage | Floor formation begins |
| Supply pressure | Visible | Controlled | Volatility capped |
| Export policy (China) | Restrictive | Stable | Predictability improves |
| Market sentiment | Bearish | Neutral–soft | Stabilization phase |
Reference: FAO – Fertilizer Statistics Database
Although December did not deliver a recovery, it reinforced the notion that phosphate prices were increasingly anchored by cost structures and downstream demand requirements, rather than speculative sentiment. Production economics—particularly the costs of ammonia and sulphur inputs—continued to limit producers’ willingness to discount aggressively. As a result, sellers focused on maintaining price stability rather than chasing volume, especially for forward deliveries into Q1.
Reference: International Fertilizer Association (IFA) – Phosphate Fertilizer Market Context
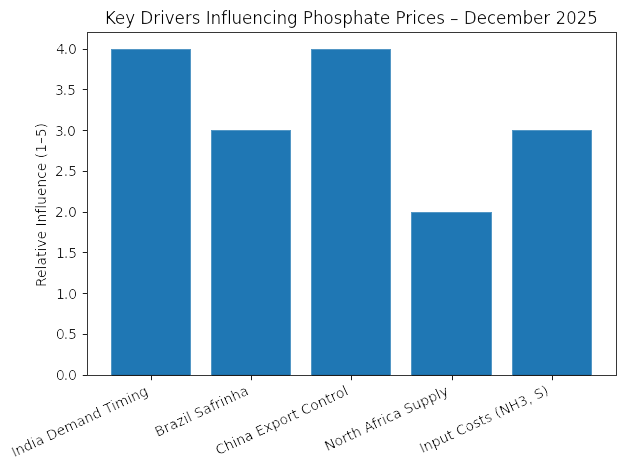
Regionally, India and Brazil remained the most influential demand centers. India’s purchasing behavior continued to set the tone for global DAP prices, but subsidy uncertainty and inventory considerations limited large-scale buying during December. In Brazil, MAP demand was constrained by cautious farm economics and delayed Safrinha positioning, though the market began to show early signs of re-engagement as Q1 planting decisions approached.
Reference:
ICIS – Global Phosphate Demand Analysis
Key Drivers Shaping the Phosphate Market in December
| Driver | Status | Impact on Prices |
|---|---|---|
| India demand | Delayed | Caps upside |
| Brazil Safrinha | Pending | Limits spot buying |
| China exports | Controlled | Reduces volatility |
| North Africa supply | Stable | Ensures availability |
| Input costs (NH₃, S) | Elevated | Supports price floor |
Reference: FAO – Fertilizer Inputs & Statistics
Outlook
Phosphate markets are expected to stabilize further in early Q1 2026, with recovery potential emerging gradually rather than abruptly. The key upside catalyst remains India’s return to active procurement, which would provide immediate support to DAP pricing. Similarly, Brazil’s Safrinha season is expected to drive incremental MAP demand, particularly if farmer margins improve and currency conditions stabilize.
Reference: International Fertilizer Association (IFA) – Global Phosphate Outlook
However, any recovery is likely to be measured and uneven, constrained by cautious buying behavior and the absence of supply shocks. The most probable scenario for Q1 2026 is a range-bound market with mild upside bias, rather than a sharp rebound. Downside risk remains limited by production costs and the interdependence of phosphates with ammonia and sulphur markets, both of which remain structurally supportive.
Reference: World Bank – Commodity Markets Outlook
Phosphate Market Recovery Triggers – Q1 2026
| Potential Trigger | Probability | Price Impact |
|---|---|---|
| India subsidy clarity | Medium | Bullish |
| Brazil Safrinha acceleration | Medium | Moderately bullish |
| Higher ammonia costs | Medium | Supportive |
| China's export tightening | Low–Medium | Bullish |
| Weak farm economics | Medium | Bearish risk |
Reference: World Bank – Fertilizer Market Risk Factors
Phosphates Market Conclusion
December 2025 confirmed that phosphate markets had entered a stabilization phase, transitioning away from the sharper November declines toward a more balanced, cost-supported environment. While demand remains selective and recovery catalysts are still pending, the market structure suggests that downside risk is increasingly limited. As Q1 2026 unfolds, phosphates are expected to follow a gradual normalization path, driven by seasonal demand rather than speculative momentum.
Reference: FAO – Fertilizer Statistics & Market Context
FREIGHT MARKET (Urea) – December 2025
Market Overview
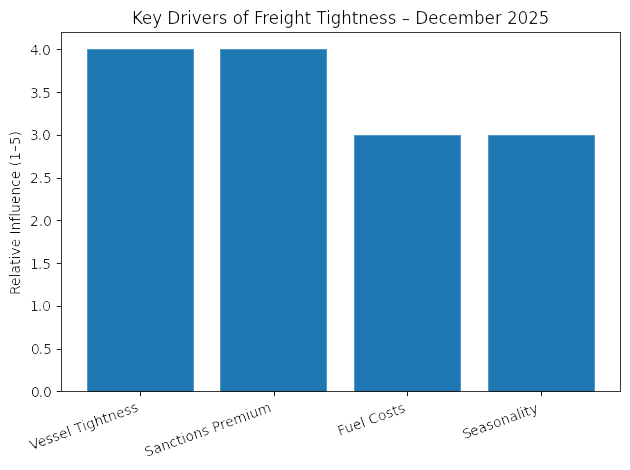
Freight markets were a defining variable in urea price formation during December 2025, playing a far more active role than in most preceding months. While underlying urea demand remained cautious, logistics costs increasingly dictated landed price competitiveness, often overriding apparent FOB price advantages. Seasonal vessel tightness, sanctions-related premiums, and route-specific constraints combined to create a freight environment that effectively established price floors in several key importing regions.
Reference: Baltic Exchange – Freight Market Information
A convergence of factors shaped December freight dynamics. Year-end vessel repositioning, holiday-related delays, and weather-linked disruptions reduced spot vessel availability, particularly for Atlantic Basin routes. At the same time, sanctions-related risk premiums and insurance costs continued to differentiate freight economics by origin, materially affecting netbacks and CFR parity calculations. As a result, freight ceased to be a neutral input and instead became astructural constraint on price declines, especially into Brazil, Turkey, and the US Gulf.
Reference: Baltic Exchange – Freight Market Information
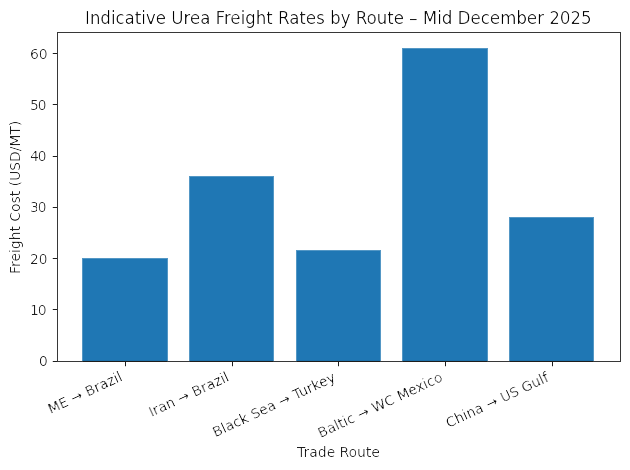
Indicative Urea Freight Rates – Mid December 202
| Route | Typical Parcel Size | Freight Range (USD/MT) | Structural Impact |
|---|---|---|---|
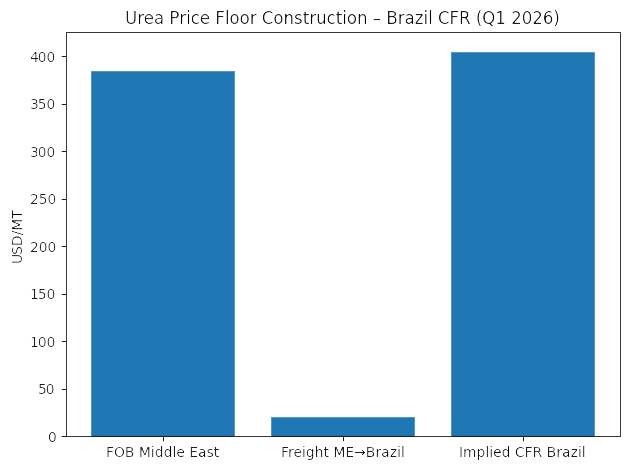
| Middle East → Brazil | 30–40 kt | 19–21 | Sets CFR floor for ME origin |
| Iran → Brazil | 45–65 kt | 35–37 | Sanctions premium limits competitiveness |
| Black Sea → Turkey | 10–15 kt | 21–22 | Regional cost support |
| Baltic → WC Mexico | 25–30 kt | 59–63 | High freight costs cap Baltic exports |
| China → US Gulf | 50–55 kt | 27–29 | Distance limits arbitrage |
Reference: Baltic Exchange – Freight Market Information
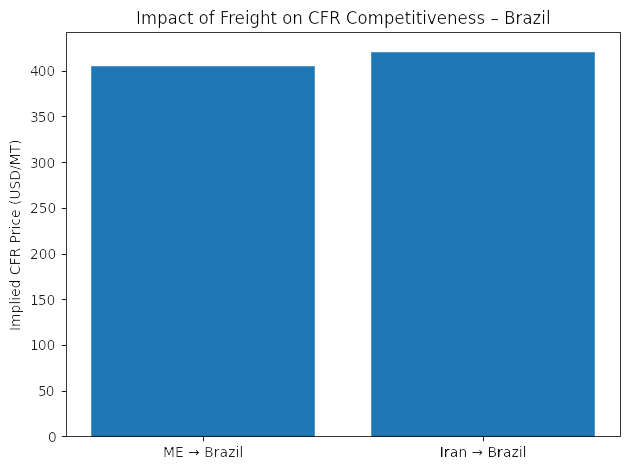
These freight spreads explain why FOB price movements alone were insufficient to trigger renewed CFR price declines in December. In several cases, sellers faced a hard limit on further discounts once freight was applied, as landed prices would otherwise fall below viable trade economics. This dynamic was evident in Brazil, where freight-adjusted costs prevented CFR prices from breaking materially below USD 390–400 despite weak importer demand.
Reference: World Bank – Commodity Markets Outlook
Freight as a Competitiveness Filter – December 2025
| Origin | FOB Flexibility | Freight Burden | Net CFR Competitiveness |
|---|---|---|---|
| Middle East | Medium | Low | Strong |
| Egypt | Low | Very low | Strong (Europe) |
| Iran | Medium | High | Limited |
| Baltic | Low | Very high | Weak |
| China | Medium | Medium–High | Route-specific |
Reference: FAO – Fertilizer Trade & Logistics Context
The December freight structure also contributed to regional divergence in urea pricing. Origins with favorable freight economics—such as the Middle East to Brazil and Egypt to Europe—maintained price discipline, while higher-cost routes effectively priced themselves out of specific markets. This reinforced the late-December shift toward forward pricing and reduced the likelihood of disorderly spot liquidation.
Reference: International Fertilizer Association (IFA) – Market Context
Outlook
Freight markets are expected to remain tight into early January 2026, as seasonal vessel constraints and year-end positioning effects persist. While some normalization is anticipated later in Q1, the pace of easing is likely to be gradual rather than abrupt. As long as vessel availability remains constrained, freight will continue to act as a stabilizing force for CFR urea prices, particularly in long-haul trade routes.
Reference: Baltic Exchange – Freight Market Information
The downside risk to freight rates primarily stems from a sharp slowdown in global bulk trade or a rapid increase in vessel availability. Conversely, any escalation in geopolitical risk, weather disruptions, or volatility in fuel costs could extend tightness and reinforce freight’s role as a price-support mechanism well into Q1 2026
Reference: World Bank – Commodity Transport & Risk Outlook
Freight Market Conclusion
December 2025 confirmed that freight was not merely a cost component but a core determinant of urea market structure. By limiting arbitrage opportunities and reinforcing CFR price floors, freight dynamics played a central role in stabilizing the global urea market following November’s correction. Entering Q1 2026, freight conditions will remain a critical variable shaping regional competitiveness, trade flow viability, and price volatility across the nitrogen complex.
Reference: Baltic Exchange – Freight Market Information
PETROCHEMICAL MARKET OVERVIEW (December 2025)
Market Context
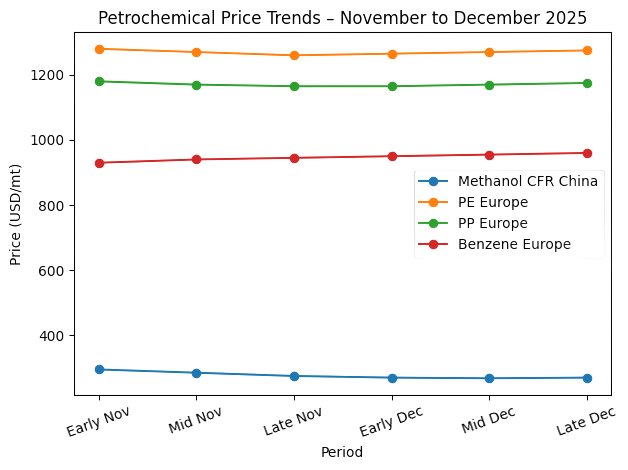
Global petrochemical markets in December 2025 were shaped primarily by energy price volatility and pronounced regional demand divergence. While crude oil and gas markets remained volatile amid geopolitical uncertainty and seasonal demand factors, downstream petrochemical segments responded unevenly. As a result, pricing dynamics across methanol, polymers, and aromatics were increasingly driven by feedstock economics and regional operating margins, rather than uniform demand growth.
Reference: ICIS – Petrochemical Market Overview
December did not deliver a synchronized directional move across petrochemicals. Instead, markets exhibited segmented behavior, with specific products under pressure from margin compression, while others remained supported by cost pass-through and logistical constraints. This divergence reinforced the importance of analyzing petrochemicals through a chain-by-chain lens, rather than as a single homogeneous market.
Reference: World Bank – Commodity Markets Outlook (Energy & Chemicals)
Methanol Market
Methanol markets remained under pressure throughout December, particularly in Asia. Weak margins for Chinese methanol-to-olefins (MTO) operators constrained operating rates and reduced incremental methanol demand. As a result, spot methanol prices struggled to gain traction despite relatively stable feedstock costs in some regions.
Reference: ICIS – Methanol Market Updates
Outside China, methanol markets showed greater resilience, supported by contractual demand and regional supply balances. However, the lack of strong pull from the MTO sector limited any sustained upside momentum. December, therefore, reinforced methanol’s position as one of the most margin-sensitive segments of the petrochemical complex.
Reference: International Energy Agency (IEA) – Chemical Feedstocks Outlook
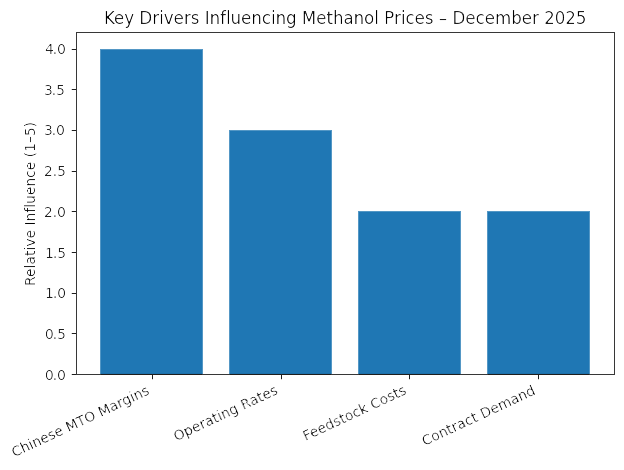
Methanol Market Drivers – December 2025
| Driver | Status | Market Impact |
|---|---|---|
| Chinese MTO margins | Weak | Suppresses demand |
| Operating rates | Reduced | Limits price support |
| Feedstock costs | Mixed | Neutral |
| Contract demand | Stable | Prevents a sharp decline |
| Spot liquidity | Adequate | Caps volatility |
Reference: ICIS – Methanol Market Updates
Polymer Markets (PE / PP)
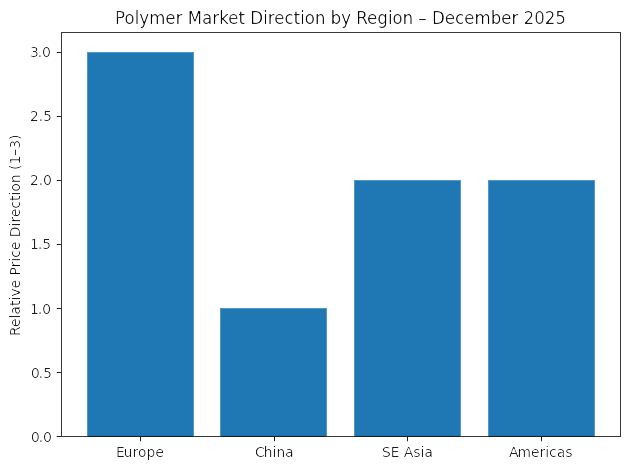
Polymer markets displayed mixed regional trends during December. In Europe, polyethylene and polypropylene prices were supported by higher energy costs, logistics constraints, and disciplined production rates. Producers focused on margin protection rather than volume growth, helping stabilize prices despite muted end-user demand.
Reference: ICIS – Polyethylene Markets, ICIS – Polypropylene Markets
In contrast, Asian polymer markets—particularly China—remained under pressure due to oversupply and cautious downstream consumption. New capacity additions and competitive export offers limited pricing power, reinforcing regional divergence within the polymer chain.
Reference: ICIS – Asian Polymer Market Analysis
Polymer Market Snapshot – December 2025
| Region | Demand Condition | Supply Balance | Price Direction |
|---|---|---|---|
| Europe | Weak–stable | Tight | Stable to firm |
| China | Weak | Long | Soft |
| Southeast Asia | Selective | Balanced | Range-bound |
| Americas | Mixed | Balanced | Stable |
Reference: ICIS – Global Polymer Market Updates
Aromatics Market
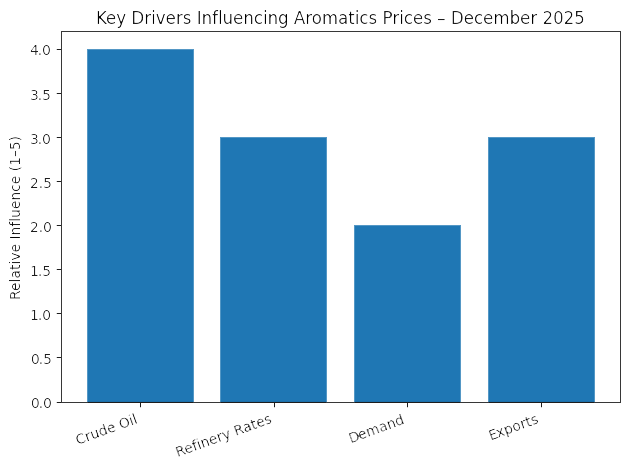
Aromatics markets in December were driven more by crude oil and energy price movements than by downstream consumption trends. Benzene prices remained relatively firm in regions where refinery operating rates were constrained, while paraxylene (PX) and toluene showed more muted behavior due to adequate supply and cautious demand.
Reference: ICIS – Aromatics Market Updates
This cost-driven dynamic highlighted the continued sensitivity of aromatics to upstream energy markets, reinforcing their role as a transmission channel between crude oil volatility and downstream chemical pricing.
Reference: U.S. Energy Information Administration (EIA) – Energy Market Analysis
Aromatics Price Drivers – December 2025
| Factor | Influence | Effect |
|---|---|---|
| Crude oil volatility | High | Cost pass-through |
| Refinery rates | Moderate | Supply control |
| Downstream demand | Weak–stable | Caps upside |
| Export flows | Active | Regional arbitrage |
Reference: ICIS – Aromatics Market Updates
Petrochemicals and Fertilizer Market Linkages
Although petrochemical markets are distinct from fertilizers, December highlighted several vital linkages. Energy volatility influenced ammonia production costs, while the weakness of the methanol and polymer markets reinforced cautious sentiment across nitrogen-related value chains. At the same time, relatively firm aromatic prices underscored the broader influence of crude oil on the economics of industrial chemicals.
Reference: World Bank – Commodity Markets Outlook
Petrochemical Market Conclusion
In December 2025, it was confirmed that petrochemical markets were operating in a fragmented, margin-driven environment. Weak demand in some segments, particularly methanol and Asian polymers, contrasted with cost-supported stability in Europe and parts of the aromatics chain. As the market enters Q1 2026, petrochemical pricing is expected to remain closely tied to energy markets, with limited scope for broad-based recovery absent a clear improvement in downstream demand.
Reference: ICIS – Petrochemical Market Overview
MARKET OUTLOOK – Q1 2026
Integrated Market Outlook
Entering Q1 2026, global fertilizer and petrochemical markets are transitioning from the post-correction stabilization phase observed in December into a period of heightened sensitivity to demand signals, logistics constraints, and policy decisions. While the sharp downside adjustment seen in November appears complete mainly, market conditions remain fragile rather than bullish, with price direction expected to be shaped by discrete catalysts rather than broad-based demand recovery.
Reference: World Bank – Commodity Markets Outlook
Across the fertilizer complex, Q1 2026 is expected to be characterized by product-level divergence. Urea enters the quarter stabilized but inherently volatile; ammonia remains structurally firm into January; sulphur is positioned for a corrective adjustment from peak levels; phosphates approach a gradual stabilization phase; and freight continues to act as a decisive swing factor for CFR pricing and regional competitiveness.
Reference: International Fertilizer Association (IFA) – Global Market Context
Product-by-Product Outlook – Q1 2026
Urea
Urea enters Q1 2026 in a range-bound but volatile position. December’s forward re-pricing into January paper suggests that a short-term price floor has formed; however, sustained upside will depend on the timing and scale of India’s next procurement cycle. India remains the single most influential demand signal for global urea pricing, with the potential to rapidly reset market sentiment if procurement volumes are significant.
Reference: Trading Economics – Urea Prices
China’s export management strategy will be equally critical. Any tightening of exports would reinforce price stability, while a more liberal export flow could cap upside and reintroduce volatility. Brazil’s purchasing behavior—particularly whether importers move beyond hand-to-mouth buying—will further determine whether CFR benchmarks act as a floor or a ceiling during Q1.
Reference: FAO – Fertilizer Trade & Statistics
Ammonia
Ammonia is expected to remain firm through January 2026, supported by structural supply tightness, limited spot availability, and resilient downstream demand from fertilizer and industrial sectors. The market remains predominantly contract-driven, limiting short-term price volatility and insulating ammonia from broader shifts in nitrogen sentiment.
Reference: ICIS – Ammonia Market Overview
The first credible correction window is anticipated in February–March 2026, contingent on the successful restart of production units and improved global availability. Delays or new outages represent a clear upside risk, while smooth restarts would allow prices to soften in a controlled manner rather than collapse.
Reference: World Bank – Commodity Markets Outlook
Sulphur
Sulphur enters Q1 2026 positioned for a corrective phase following the exceptional November rally. December’s demand resistance—particularly from China—signals that affordability constraints are reasserting influence over price formation. As supply visibility improves and panic buying subsides, prices are expected to adjust lower from peak levels.
Reference: Trading Economics – Sulphur Prices
However, the correction is expected to be orderly rather than disruptive, as structural support from the phosphate value chain and limited inventory flexibility prevent a return to mid-2025 lows. Volatility is therefore likely to remain elevated, especially if downstream phosphate demand strengthens.
Reference: FAO – Fertilizer Inputs & Statistics
Phosphate
Phosphate markets are expected to stabilize gradually in early Q1 2026, with recovery potential emerging unevenly across regions. India’s subsidy clarity and procurement timing remain the primary upside catalysts for DAP, while Brazil’s Safrinha season will be decisive for MAP demand.
Reference: International Fertilizer Association (IFA) – Global Phosphate Outlook
Any recovery is likely to be measured rather than sharp, constrained by cautious importer behavior and the absence of supply shocks. Elevated input costs—particularly ammonia and sulphur—should continue to support price floors, limiting downside risk.
Reference: ICIS – Phosphates Market Updates
Freigh
Freight will remain a key swing factor in Q1 2026, particularly for urea. Tight vessel availability and route-specific constraints are expected to persist into early January, continuing to define CFR price floors and regional competitiveness.
Reference: Baltic Exchange – Freight Market Information
While some easing is anticipated later in Q1, the normalization path is likely to be gradual. Any geopolitical escalation, weather disruption, or volatility in fuel costs could prolong tightness and reinforce freight’s stabilizing influence on fertilizer prices
Q1 2026 Scenario Framework
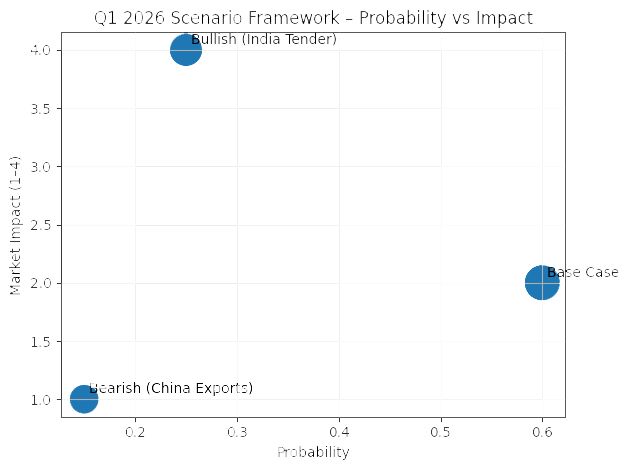
Base Case (Most Likely)
| Element | Assumption | Market Impact |
|---|---|---|
| India's urea demand | Gradual return | Supports prices |
| China exports | Managed | Caps volatility |
| Ammonia supply | Tight until Feb | Firm prices |
| Sulphur | Controlled correction | Elevated volatility |
| Freight | Tight early, easing later | CFR price support |
Reference:
World Bank – Commodity Markets Outlook
Risk Scenarios
| Risk | Probability | Price Impact |
|---|---|---|
| Large India urea tender | Medium | Bullish |
| China's export loosening | Medium | Bearish |
| Ammonia restart delays | Medium | Bullish |
| Freight disruption | Low–Medium | Bullish |
| Weak Brazil demand | Medium | Bearish |
Reference: FAO – Fertilizer Market Risk Indicators
Outlook Conclusion
Q1 2026 is expected to be a structurally sensitive quarter, defined less by broad demand recovery and more by event-driven price discovery. While the aggressive correction phase appears complete, markets remain exposed to volatility stemming from tenders, policy decisions, and logistics constraints. In this environment, strategic positioning, timing, and freight awareness will be critical for navigating price risk and trade execution across the fertilizer and petrochemical complex.
Reference: International Fertilizer Association (IFA) – Market Context
Conclusion
December 2025 confirmed that global fertilizer and petrochemical markets had successfully transitioned away from the November shock-driven correction into a more disciplined, structurally balanced environment. Unlike November—when price discovery was dominated by abrupt demand shocks, forced liquidation, and rapid sentiment shifts—December was defined by consolidation, forward re-pricing, and regional divergence. While underlying demand remained cautious and highly selective, price behavior across most products suggested the market had mainly absorbed the downside adjustment and established clearer near-term reference points.
Reference: International Fertilizer Association (IFA) – Global Market Context
Across the nitrogen complex, December highlighted the importance of
structural differentiation rather than uniform market movement. Urea stabilized and began to reprice higher on January paper; ammonia remained firmly supply-led and insulated from broader weakness; sulphur transitioned from an exceptional rally into a controlled normalization phase; and phosphates approached stabilization under the influence of cost support and seasonal demand expectations. This divergence underscores that fertilizer markets are increasingly driven by
product-specific fundamentals rather than synchronized cycles.
Reference: World Bank – Commodity Markets Outlook
Freight emerged as one of the most decisive variables shaping December outcomes. Rather than acting as a passive cost component, logistics constraints actively influenced CFR pricing, origin competitiveness, and trade feasibility. Seasonal vessel tightness, route-specific premiums, and sanctions-related costs reinforced freight’s role as a
price-floor mechanism, particularly for urea flows into Brazil, India, and the Atlantic Basin. This dynamic materially reduced the risk of disorderly price declines despite weak spot demand.
Reference: Baltic Exchange – Freight Market Information
December 2025 – Key Market Takeaways by Segment
| Segment | December Outcome | Structural Implication |
|---|---|---|
| Urea | Stabilization & January re-pricing | Correction phase largely complete |
| Ammonia | Firm, low volatility | Supply-led, contract-driven market |
| Sulphur | Demand resistance emerges | Transition from rally to correction |
| Phosphates | Soft but stabilizing | Cost-supported floor forming |
| Freight | Tight, price-supportive | CFR floors reinforced |
Reference: FAO – Fertilizer Statistics Database
December also reinforced a critical strategic lesson for market participants: timing and execution now matter more than outright price direction. With markets transitioning to a range-bound, event-driven phase, opportunities increasingly depend on freight availability, tender timing, regional arbitrage, and forward positioning rather than on speculative price momentum. Participants who successfully navigated December were those who adjusted quickly to changing logistics conditions and differentiated between paper signals and physical demand realities.
Reference: International Fertilizer Association (IFA) – Market Analysis
Looking ahead into Q1 2026, the fertilizer complex is expected to remainvolatile but structurally supported. Price direction will hinge on discrete catalysts—most notably India’s next urea procurement cycle, China’s export management strategy, Brazil’s purchasing confidence, ammonia supply restarts, and freight market normalization. While upside and downside risks remain, the likelihood of a repeat of November’s disorderly correction appears limited under current conditions.
Reference: World Bank – Commodity Markets Outlook
Strategic Implications Entering Q1 2026
| Focus Area | Why It Matters |
|---|---|
| Tender visibility (India) | Primary urea price reset trigger |
| Freight monitoring | Determines CFR competitiveness |
| Forward paper signals | Early indication of sentiment shifts |
| Regional divergence | Avoids overgeneralized positioning |
| Supply reliability | Critical for ammonia & sulphur |
Reference: International Fertilizer Association (IFA) – Global Market Context
Final Assessment
December 2025 marked the end of the correction phase and the beginning of a more structurally driven market regime. While demand recovery remains incomplete, the market’s behavior signals improved balance and reduced downside risk. As Q1 2026 unfolds, success will depend less on predicting absolute price direction and more on understanding structural constraints, logistics dynamics, and event-driven catalysts across the fertilizer and petrochemical landscape.
Reference: FAO – Fertilizer Market Context
REFERENCES
- Argus Media – Global Fertilizer & Petrochemical Pricing
- CRU Group – Fertilizers & Metals Market Analysis
- Armaiti Mercantile Exchange (Armaiti MEX)
- Marlen Group – Market Analytics
- International Fertilizer Association (IFA)
- World, Commodity Markets
- FAO Fertilizer Statistics
- Trading Economics – Urea
- Trading Economics – Sulphur
- ICIS Fertilizers
- ICIS Ammonia
- ICIS Phosphates
- ICIS Petrochemicals
- Baltic Exchange Freight Data
- European Commission – CBAM
- USDA AMS Fertilizer Reports