January 2026 Global Fertilizer & Petrochemical Market Report
January 2026 fertilizer market report covering urea, ammonia, sulphur, phosphates, freight dynamics, geopolitics, and the
Q1–Q2 2026 outlook.
Author: Saman Memarpour
Executive Summary
Market Transition and Structural Context
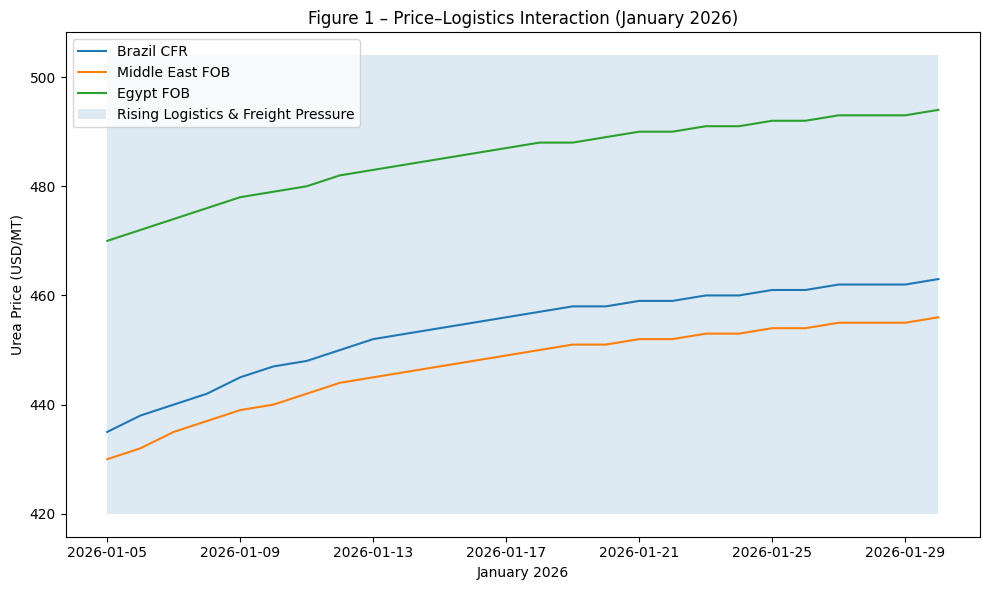
January 2026 represented a clear inflection point in global fertilizer markets, marking the transition from post-correction stabilization into a phase of structurally supported price escalation. While December 2025 was characterized by consolidation, cautious forward positioning, and selective buying, January confirmed that the market had absorbed prior downside risks and established a firmer pricing baseline. Price increases across key fertilizer products—most notably granular urea—were not driven by speculative behavior or short-term sentiment, but by tangible constraints in physical supply, logistics execution, and freight availability.
This structural shift was evident in the alignment between paper markets and physical realities. Forward curves strengthened early in the month and were subsequently validated by sustained congestion at export and discharge ports, limited jetty availability, and rising freight rates. As a result, the market transitioned from a sentiment-led environment to one where physical constraints actively enforced price levels, even in the absence of aggressive downstream demand.
Source: International Fertilizer Association (IFA) – Market Context
Nitrogen Complex Overview
Within the nitrogen complex, urea was the clear leader in January’s market advance. Granular urea benchmarks across Brazil CFR, Middle East FOB (Persian Gulf), Egypt FOB (Europe), and the US Gulf demonstrated consistent upward repricing throughout the month. Notably, this price progression occurred despite still-selective end-user purchasing, confirming that supply-side limitations rather than demand acceleration were the dominant force.
Ammonia markets remained structurally firm and insulated mainly from urea volatility. Contractual pricing mechanisms, constrained spot availability, and inelastic downstream demand maintained stability across key regions. Sulphur, by contrast, entered January transitioning from its late-2025 peak into a controlled normalization phase, as resistance emerged at higher price levels while production-linked demand from phosphates provided a cost-supported floor. Phosphate markets continued to stabilize, supported more by upstream input costs than by a broad-based recovery in consumption.
Source: World Bank – Commodity Markets Outlook
Logistics, Freight, and Physical Market Constraints
One of the defining features of January 2026 was the decisive role of logistics and freight in shaping market outcomes. Persistent congestion at key ports—particularly in the Persian Gulf and along the Iranian port line—materially constrained the prompt availability of urea and other bulk commodities. Jetty shortages, extended anchorage waiting times, and competition with iron ore, sulphur, and steel cargoes reduced supply elasticity and delayed physical execution.
Freight markets amplified these constraints. Tight vessel availability, elevated insurance premiums linked to Middle East geopolitical risk, and longer turnaround times translated into higher landed costs and reinforced CFR price floors. In practical terms, freight shifted from a secondary cost variable to a primary price-enforcement mechanism, preventing rapid arbitrage-driven corrections.
Source: Baltic Exchange – Dry Bulk & Fertilizer Freight
Visual Summary of January 2026 Market Dynamics
Table 1 – Key Market Drivers (December 2025 vs January 2026)
| Factor | December 2025 | January 2026 | Market Implication |
|---|---|---|---|
| Price behavior | Range-bound consolidation | Sustained upward repricing | Structural support established |
| Supply conditions | Adequate on paper | Constrained in execution | Physical tightness |
| Logistics | Manageable | Congested ports & jetty limits | Delayed availability |
| Freight | Supportive | Constraining | CFR price floor |
| Geopolitical impact | Absorbed | Priced-in risk premium | Elevated costs |
Source: Green Gubre Group
Figure 1 – Conceptual Price–Logistics Interaction (January 2026)
Strategic Interpretation
Taken together, January 2026 confirmed that fertilizer markets had entered a phase where physical execution risks, logistics capacity, and geopolitical considerations outweighed short-term demand fluctuations. Prices advanced not because buyers became more aggressive, but because the system’s ability to deliver product promptly was impaired. This environment favors disciplined suppliers, penalizes speculative short positions, and elevates the importance of logistics visibility and freight strategy for all market participants.
Market Phase Comparison – December 2025 vs January 2026
Structural Transition Overview
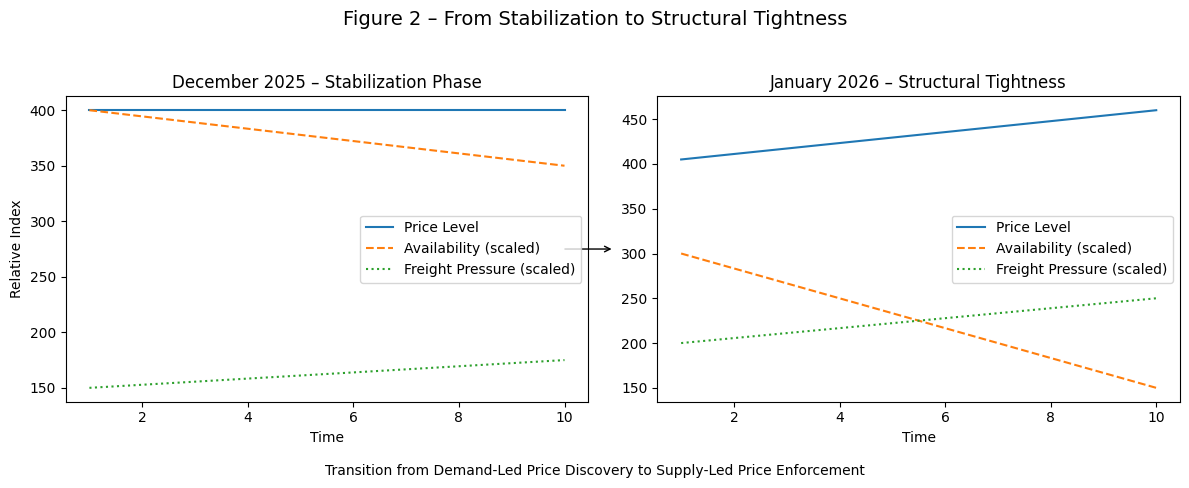
The transition from December 2025 to January 2026 marked a fundamental change in how fertilizer markets functioned. December marked a post-shock stabilization phase, during which prices consolidated after the sharp November correction. Market participants focused on rebuilding confidence, re-establishing reference prices, and cautiously repositioning forward exposure. Liquidity improved, but conviction remained limited, and price movements were largely reactive rather than directional.
By contrast, January 2026 confirmed a shift into a
structurally tight, supply-led market phase. Price formation became increasingly detached from short-term demand signals and instead anchored to execution constraints, logistics friction, and geopolitical risk premiums. This transition was visible not only in price behavior but also in freight markets, port congestion, and the narrowing gap between paper and physical availability.
Source: FAO – Fertilizer Market Context
Comparative Framework
Table 2 – Market Phase Comparison
| Dimension | December 2025 | January 2026 | Strategic Interpretation |
|---|---|---|---|
| Dominant market driver | Post-correction stabilization | Structural supply tightness | Shift from balance-seeking to constraint-driven pricing |
| Price behavior | Range-bound, corrective | Sustained upward repricing | Price floor transforms into a platform |
| Demand influence | Selective, price-sensitive | Secondary to supply execution | Demand no longer sets the marginal price |
| Paper vs physical | Paper-led recovery | Paper validated by logistics | Physical constraints confirm paper strength |
| Freight dynamics | Supportive but flexible | Constraining and directional | Freight becomes a price-enforcement tool |
| Logistics conditions | Manageable congestion | Persistent jetty & anchorage bottlenecks | Reduced effective supply elasticity |
| Risk profile | Correction largely absorbed | Event-driven volatility | Geopolitics and logistics dominate |
| Market psychology | Defensive positioning | Disciplined seller behavior | Reduced incentive to discount |
Source: FAO; Green Gubre Group analysis based on Armaiti MEX
Visual Interpretation of the Phase Shift
Figure 2 – From Stabilization to Structural Tightness (Conceptual Framework)
Source: Green Gubre Group
Freight and Logistics as the Turning Point
The most critical differentiator between December and January was the role of freight and logistics. In December, freight supported pricing by preventing a deep downside correction, while remaining sufficiently flexible to allow arbitrage flows. In January, freight availability tightened sharply, insurance costs rose amid war-related risks in the Middle East, and port congestion intensified. These factors collectively transformed freight from a background cost into an active constraint on trade flows.
This shift explains why January prices continued to rise despite unchanged or even cautious end-user demand. The market no longer cleared through price alone; it cleared through
execution capacity, redefining the mechanics of price discovery.
Source: Baltic Exchange – Dry Bulk & Fertilizer Freight
Strategic Implications
The December–January transition highlights a broader structural lesson for fertilizer markets: once logistics and freight constraints become binding, traditional demand indicators lose explanatory power. For producers and traders, January 2026 underscored the importance of logistics control, freight optionality, and execution timing. For buyers, it reinforced the risk of delaying procurement in environments where physical capacity—not production—is the limiting factor.
Market Phase Comparison – December 2025 vs January 2026
1. Nitrogen – Urea Market (January 2026)
1.1 Global Urea Price Overview
January 2026 confirmed a decisive upward repricing phase across global urea markets, marking the strongest month-on-month performance since Q3 2025. Granular urea paper markets led the move early in the month, with forward values consistently adjusted higher and subsequently validated by physical offers. This sequencing—paper first, physical confirmation later—signals a structurally supported market rather than a liquidity-driven spike.
Across all major benchmarks, price advances were both sustained and geographically synchronized. Brazil CFR, Egypt FOB (Europe), Middle East FOB (Persian Gulf), and US Gulf FOB all recorded multi-week gains, culminating in late-January consolidation at elevated levels rather than corrective retracement. Importantly, volatility remained contained, indicating disciplined selling behavior rather than speculative overshooting.
Source: Armaiti Mercantile Exchange (Armaiti MEX) – Daily Urea Reports
By month-end, Brazil CFR values had firmly moved into the mid-USD 450s, Egypt FOB strengthened toward the high-USD 480s, and Middle East FOB stabilized in the low-to-mid USD 450s. These price levels were maintained despite limited spot buying activity, underscoring that sellers were constrained by logistics and execution capacity rather than incentivized to discount to stimulate demand.
Source: ICIS – Fertilizer Market Updates
Table 3 – Indicative Urea Price Ranges (End-January 2026)
| Benchmark | Price Range (USD/MT) | Monthly Trend | Market Signal |
|---|---|---|---|
| Brazil CFR | 450–460 | Upward | Freight-enforced CFR floor |
| Egypt FOB (Europe) | 480–490 | Upward | Supply security premium |
| Middle East FOB (Persian Gulf) | 445–455 | Upward | Disciplined producer selling |
| US Gulf FOB | 430–440 | Upward | Atlantic Basin stabilization |
Source: Armaiti MEX; ICIS; Green Gubre Group analysis
1.2 Physical Market Validation – Ports, Line-Ups, and Congestion
January’s price escalation was fully corroborated by physical market evidence. Detailed jetty and anchorage line-up data from Rajaie and Bahonar ports revealed persistent vessel queues, repeated “lack of jetty” status, and slow discharge rates across urea, sulphur, and competing bulk commodities such as iron ore, HBI, and billets. These conditions were not episodic but persistent throughout the month.
Notably, urea vessels remained in anchorage for extended periods even when documentation and cargo readiness were complete. This confirms that
port capacity and discharge constraints—not demand weakness—were the binding limitation on supply flow. In practical terms, this reduced prompt availability and increased execution risk, reinforcing seller leverage in negotiations.
This congestion materially reduced the elasticity of adequate supply. Even where theoretical availability existed on paper, delays in physical execution prevented rapid market balancing. As a result, January pricing behavior reflected logistics-enforced scarcity, a defining characteristic of structurally supported commodity markets.
Source: World Bank – Commodity Transport & Logistics Risk
1.3 Regional Market Insights
Middle East (Persian Gulf)
The Persian Gulf urea market played a central stabilizing role throughout January 2026. FOB values advanced steadily as producers maintained disciplined selling strategies amid constrained logistics, elevated freight rates, and heightened geopolitical risk. War-related developments in the broader Middle East increased insurance costs and operational caution, indirectly reinforcing supply discipline without directly disrupting production output. As a result, the region functioned as a price anchor rather than a pressure point.
Source:
International Fertilizer Association (IFA) – Middle East Market Context
Egypt FOB (Europe)
Egyptian FOB values continued to command a premium over other origins, supported by sustained European demand, proximity advantages, and regulatory-driven supply security considerations. January strength reflected Europe’s willingness to pay for reliability amid CBAM-related cost pass-through and elevated energy prices. Egypt remained one of the most resilient and strategically important exporting origins globally.
Source:
European Commission – Fertilizer & CBAM Context
Brazil CFR
Brazilian demand remained cautious and price-sensitive, yet CFR prices advanced amid global supply constraints and freight economics. Brazil once again acted as a price validator, confirming that sub-USD 400 CFR levels were no longer feasible under prevailing logistics and freight conditions. This reinforced Brazil’s role as a key reference market for global urea pricing.
Source:
Trading Economics – Brazil Fertilizer Prices
United States (US Gulf)
The US Gulf urea market strengthened further in January, supported by tightening inventories, improved export parity, and reduced availability from alternative origins. This reinforced Atlantic Basin stabilization and removed a key bearish overhang that had constrained sentiment during Q4 2025.
Source:
USDA Agricultural Marketing Service – Fertilizer Reports
Structural Transition Overview
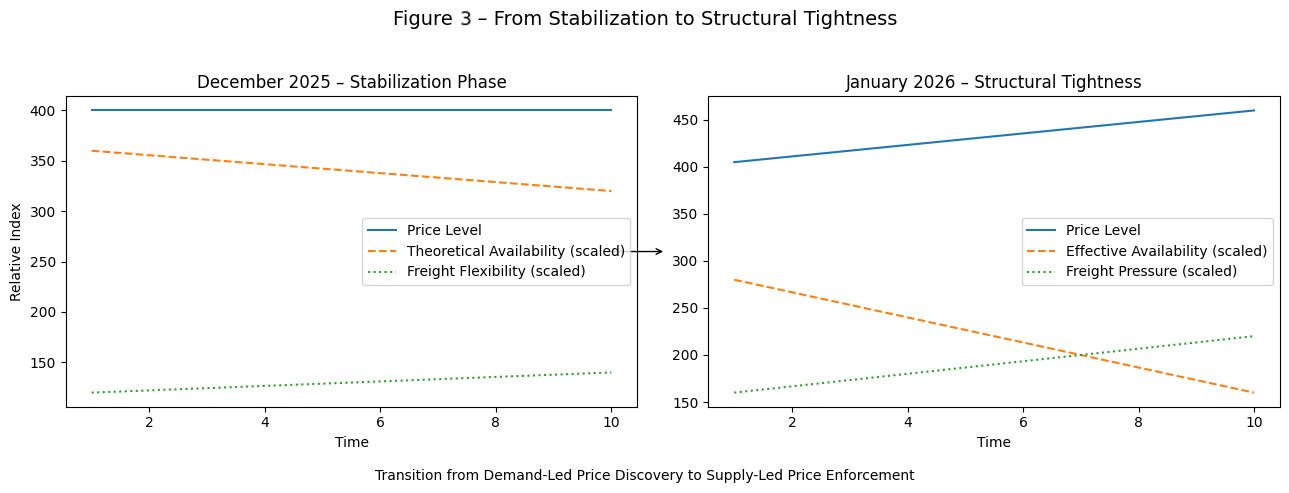
The transition from December 2025 to January 2026 marked a fundamental change in how fertilizer markets functioned. December marked a post-shock stabilization phase, during which prices consolidated after the sharp November correction. Market participants focused on rebuilding confidence, re-establishing reference prices, and cautiously repositioning forward exposure. Liquidity improved, but conviction remained limited, and price movements were largely reactive rather than directional.
By contrast, January 2026 confirmed a shift into a
structurally tight, supply-led market phase. Price formation became increasingly detached from short-term demand signals and instead anchored to execution constraints, logistics friction, and geopolitical risk premiums. This transition was visible not only in price behavior but also in freight markets, port congestion, and the narrowing gap between paper and physical availability.
Source: FAO – Fertilizer Market Context
Comparative Framework
Table 4 – Market Phase Comparison
| Dimension | December 2025 | January 2026 | Strategic Interpretation |
|---|---|---|---|
| Dominant market driver | Post-correction stabilization | Structural supply tightness | Shift from balance-seeking to constraint-driven pricing |
| Price behavior | Range-bound, corrective | Sustained upward repricing | Price floor transforms into a platform |
| Demand influence | Selective, price-sensitive | Secondary to supply execution | Demand no longer sets the marginal price |
| Paper vs physical | Paper-led recovery | Paper validated by logistics | Physical constraints confirm paper strength |
| Freight dynamics | Supportive but flexible | Constraining and directional | Freight becomes a price-enforcement tool |
| Logistics conditions | Manageable congestion | Persistent jetty & anchorage bottlenecks | Reduced effective supply elasticity |
| Risk profile | Correction largely absorbed | Event-driven volatility | Geopolitics and logistics dominate |
| Market psychology | Defensive positioning | Disciplined seller behavior | Reduced incentive to discount |
Source: FAO; Green Gubre Group analysis based on Armaiti MEX
Visual Interpretation of the Phase Shift
Figure 3 – From Stabilization to Structural Tightness (Conceptual Framework)
Source: Green Gubre Group synthesis
Freight and Logistics as the Turning Point
The most critical differentiator between December and January was the role of freight and logistics. In December, freight supported pricing by preventing a deep downside correction, while remaining sufficiently flexible to allow arbitrage flows. In January, freight availability tightened sharply, insurance costs rose amid war-related risks in the Middle East, and port congestion intensified. These factors collectively transformed freight from a background cost into an active constraint on trade flows.
This shift explains why January prices continued to rise despite unchanged or even cautious end-user demand. The market no longer cleared through price alone; it cleared through
execution capacity, redefining the mechanics of price discovery.
Source: Baltic Exchange – Dry Bulk & Fertilizer Freight
Strategic Implications
The December–January transition highlights a broader structural lesson for fertilizer markets: once logistics and freight constraints become binding, traditional demand indicators lose explanatory power. For producers and traders, January 2026 underscored the importance of logistics control, freight optionality, and execution timing. For buyers, it reinforced the risk of delaying procurement in environments where physical capacity—not production—is the limiting factor.
2. Ammonia Market (January 2026)
2.1 Market Structure and Price Formation
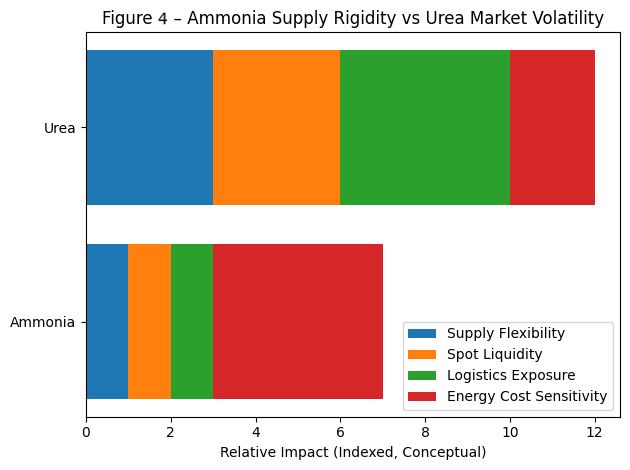
The global ammonia market remained structurally firm and contract-driven throughout January 2026, continuing a trend established in late 2025. Unlike urea, ammonia pricing showed minimal sensitivity to short-term sentiment, freight volatility, or speculative paper activity, reflecting its upstream position in the nitrogen value chain and its heavy reliance on long-term contractual arrangements.
Spot market liquidity remained thin across all major regions. The majority of global ammonia volumes continued to move under annual or semi-annual contracts, effectively insulating prices from short-term demand fluctuations. As a result,
no meaningful price softening occurred, even as downstream fertilizer markets experienced episodic pauses in buying activity.
This structural rigidity confirms ammonia’s role as the
cost anchor of the nitrogen complex, setting a baseline for downstream nitrogen pricing rather than reacting to it.
Source: ICIS – Ammonia Market Overview
2.2 Supply Discipline and Production Constraints
On the supply side, January conditions remained tight due to a combination of operational discipline, maintenance schedules, and limited incentives for production ramp-ups. Producers prioritized contractual obligations and margin protection over incremental spot placements, reinforcing price stability.
Energy economics continued to define the ammonia supply ceiling. Elevated and volatile natural gas prices in key producing regions constrained aggressive output expansion, particularly in areas where feedstock procurement risk remained high. Unlike urea, where logistics congestion constrained availability, ammonia tightness was primarily
production- and energy-cost driven.
Geopolitical uncertainty—particularly across the Middle East—further reinforced conservative production strategies. While ammonia production was not directly disrupted, heightened risk perception discouraged operational flexibility and reinforced seller discipline.
Source: World Bank – Energy & Fertilizer Input Costs
Figure 4 – Ammonia Supply Rigidity vs Market Volatility
Source: Green Gubre Group synthesis based on ICIS and World Bank data
2.3 Demand Characteristics and Downstream Linkages
Downstream ammonia demand remained inelastic throughout January. Industrial consumers and fertilizer producers continued to lift contractual volumes despite short-term price considerations, prioritizing supply continuity and operational certainty.
This behavior sharply contrasted with urea markets, where buyers actively adjusted timing and volumes. In ammonia, demand destruction mechanisms were limited, reinforcing price stability even in regions where downstream fertilizer demand was hesitant.
Significantly, ammonia flows were shielded mainly from freight escalation and port congestion pressures that affected other nitrogen products. Established contractual shipping routes and lower turnover frequency reduced exposure to short-term logistics disruption.
Source: International Fertilizer Association (IFA) – Nitrogen Supply Chain Analysis
Table 4 – Ammonia vs Urea: Structural Market Comparison (January 2026)
| Dimension | Ammonia | Urea | Strategic Implication |
|---|---|---|---|
| Market structure | Contract-driven | Spot & paper-driven | Ammonia less volatile |
| Spot liquidity | Very limited | Moderate | Price rigidity in ammonia |
| Sensitivity to sentiment | Low | High | Different risk profiles |
| Primary constraint | Production & energy | Logistics & freight | Different price drivers |
| Role in the nitrogen chain | Cost anchor | Margin product | Ammonia sets the floor |
Source: ICIS; Green Gubre Group analysis
2.4 Strategic Interpretation
January 2026 reaffirmed ammonia’s position as the stabilizing anchor of the nitrogen complex. While urea prices advanced under logistics-enforced scarcity, ammonia prices remained firm due to structural supply discipline and energy-driven cost floors.
For producers, ammonia reinforced the value of
contract positioning and energy risk management. For downstream nitrogen markets, it provided a stable reference point that limited the scope for aggressive price corrections, even during periods of selective fertilizer demand.
Source: ICIS – Ammonia Market Outlook
Sulphur Market (January 2026)
3.1 Market Overview – From Peak to Controlled Normalizatio
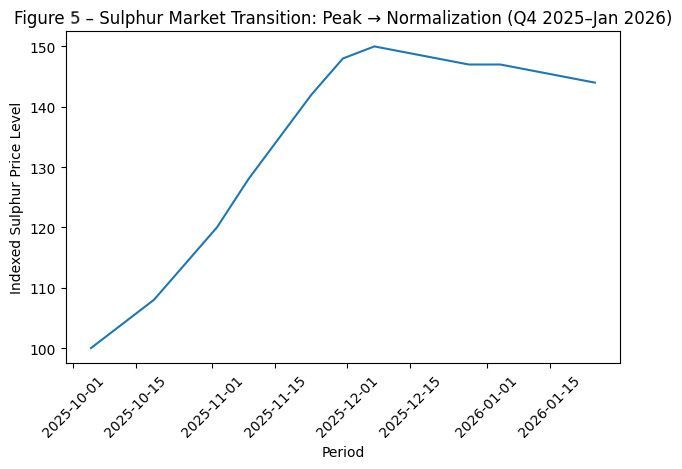
January 2026 confirmed that the global sulphur market had entered a post-peak normalization phase, following the exceptional rally observed in late 2025. However, unlike a typical cyclical correction, price adjustment during January remained orderly and structurally supported, with no signs of capitulation or forced liquidation.
nWhile demand resistance—particularly from price-sensitive Asian buyers—tempered further upside momentum, sulphur prices did not experience a sharp retracement. Instead, values consolidated at elevated levels, reflecting the market’s transition from speculative scarcity pricing towardcost- and production-linked equilibrium.
This behavior underscores that sulphur’s late-2025 rally was not entirely speculative. Structural demand from the phosphate sector, combined with persistent logistics friction, prevented a rapid reversion to historical averages
Source: ICIS – Sulphur Market Updates
3.2 Demand Dynamics – Phosphates as the Structural Backbon
Sulphur demand during January was primarily anchored by phosphate fertilizer production, particularly in North Africa, the Middle East, and China. While downstream phosphate demand growth slowed relative to Q4 2025, production continuity remained critical to sustain sulphur offtake.
eAsian spot demand—especially from China and Southeast Asia—showed increased price sensitivity, limiting the willingness to chase higher numbers. However, this resistance manifested asbuying deferral rather than demand destruction. Producers and processors prioritized operational continuity, reinforcing a stable demand floor.
As a result, sulphur demand functioned asymmetrically
- Limited upside elasticity due to buyer resistance
- Strong downside protection due to phosphate-linked baseline consumption
Source: International Fertilizer Association (IFA) – Phosphate & Sulphur Linkages
Figure 5 – Sulphur Market Transition: Peak → Normalization (Q4 2025–Jan 2026
Source: ICIS; Green Gubre Group synthesis
3.3 Supply, Logistics, and Port Congestion Effects
On the supply side, sulphur availability remained constrained not by production shortfalls but by logistics and execution bottlenecks. Port congestion—particularly in Iranian and Persian Gulf export corridors—continued to affect sulphur cargo movements alongside urea and other bulk commodities.
Jetty congestion and anchorage delays reduced adequate prompt availability, limiting sellers’ ability to rapidly clear inventories even as prices softened marginally. This constrained downside flexibility and delayed price discovery, reinforcing sulphur’s gradual adjustment path.
Notably, sulphur competed directly with urea and iron-bearing commodities for discharge capacity, tying its price behavior increasingly to
port throughput limitations rather than pure supply-demand balance.
Source: World Bank – Maritime Logistics & Bulk Trade Constraints
Table 5 – Sulphur Market Drivers and Price Impact (January 2026)
| Driver | Market Effect | Price Implication |
|---|---|---|
| Phosphate production | Sustained baseline demand | Downside protection |
| Asian buyer resistance | Slower price discovery | Limited upside |
| Port congestion | Reduced prompt availability | Price stickiness |
| Freight competition | Execution delays | Volatility dampening |
| Post-peak psychology | Cautious repositioning | Orderly normalization |
Source: ICIS; Green Gubre Group analysis
3.4 Strategic Interpretation
January 2026 demonstrated that sulphur had exited its speculative rally phase but had not entered a corrective collapse. Instead, the market transitioned into a structurally supported normalization regime, where phosphate-linked demand and logistics friction absorbed selling pressure.
For market participants, sulphur reinforced an important strategic lesson:
In environments where logistics capacity is constrained, even declining demand does not automatically translate into falling prices.
Sulphur thus acted as a
bridge product between nitrogen and phosphates—less volatile than urea, less rigid than ammonia, but increasingly sensitive to port and freight dynamics.
Source: ICIS – Sulphur Market Analysis
4. Phosphates Market (January 2026)
4.1 Market Overview – Soft Demand, Firm Cost Floors
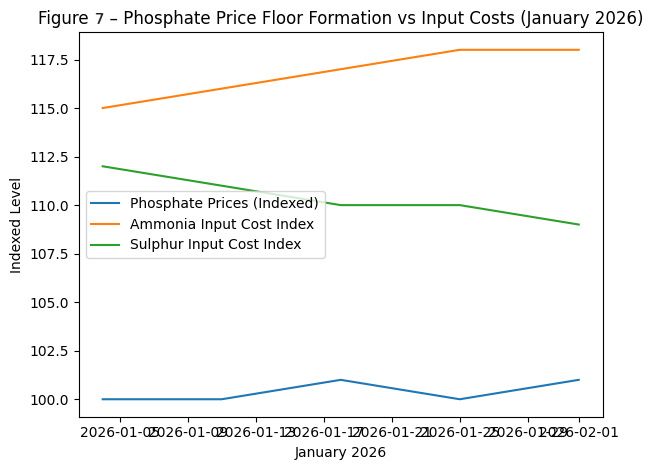
Phosphate fertilizer markets remained soft but structurally stable throughout January 2026. Prices largely traded within narrow ranges, reflecting a balance between selective downstream demand and elevated upstream cost support. Unlike urea, phosphates did not experience speculative momentum or logistics-driven escalation; however, equally important, they avoided any meaningful downside correction.
This stability was not demand-led. Instead, phosphate pricing remained anchored by
high ammonia and sulphur input costs, thereby reinforcing production cost floors. As a result, sellers showed limited willingness to discount aggressively, even in the absence of strong import tenders or broad-based buying programs.
January, therefore, positioned phosphates in a
holding pattern—neither recovering nor correcting—setting the stage for gradual normalization rather than a sharp rebound.
Source: FAO – Phosphate Fertilizer Statistics
4.2 Cost Structure – Ammonia and Sulphur as Price Anchors
The most decisive factor shaping phosphate behavior in January was the upstream cost environment. Persistently firm ammonia pricing and only modest sulphur normalization kept production costs high across DAP and MAP producers globally. This cost pressure translated directly into price floors, limiting sellers’ ability to respond to buyer resistance through price concessions.
In practical terms, phosphates became
cost-constrained rather than demand-responsive. Even where downstream consumption slowed, production economics discouraged inventory liquidation, reinforcing range-bound price behavior.
This dynamic further differentiates phosphates from urea:
- Urea prices moved due to logistics and execution constraints
- Phosphate prices held due to
input-cost rigidity
Source: World Bank – Fertilizer Input Costs & Nutrient Economics
Figure 6 – Phosphate Price Floor Formation vs Input Costs

Source: FAO; ICIS; Green Gubre Group synthesis
4.3 Demand Patterns – India and Brazil as Selective Buyers
On the demand side, January activity remained highly selective. India and Brazil—two of the most influential phosphate importers—continued to purchase cautiously, focusing on inventory management rather than forward accumulation. Tender activity was limited, and buyers demonstrated strong price discipline.
However, this selectivity did not translate into market weakness. The absence of distressed selling and the presence of cost-based price floors meant that deferred demand did not exert downward pressure. Instead, buying decisions shifted from timing optimization to risk management, particularly amid geopolitical uncertainty and volatile nitrogen inputs.
Source: FAO – Global Fertilizer Trade Flows
Table 6 – Phosphates Market Drivers and Price Impact (January 2026)
| Driver | Market Effect | Price Outcome |
|---|---|---|
| Ammonia costs | Elevated | Strong price floor |
| Sulphur normalization | Gradual | No sharp downside |
| India demand | Selective | Range-bound pricing |
| Brazil demand | Inventory-focused | Limited upside |
| Supply conditions | Stable | No shock-driven moves |
Source: FAO; ICIS; Green Gubre Group analysis
4.4 Strategic Interpretation
In January 2026, phosphate markets were confirmed to have entered a cost-anchored stabilization phase. Prices were no longer responding primarily to demand signals but were instead governed by upstream input economics and disciplined supply behavior.
This positioning makes phosphates a
lagging but stabilizing component of the broader fertilizer complex. While they did not lead market direction in January, their resistance to downside correction reinforced the broader structural tightness narrative across nutrients.
For market participants, phosphates underscored a key lesson:
When input costs remain elevated, demand alone is not enough to trigger a price correction.
Source: FAO – Fertilizer Market Context
5. Freight Market (Urea) – January 2026
5.1 Freight as a Structural Market Driver
Freight emerged as one of the most decisive and price-enforcing variables in the global urea market during January 2026. Unlike December—when freight acted primarily as a supportive cost component preventing deeper downside—January marked a transition in which freight availability, vessel positioning, and execution risk became binding constraints on trade flows.
Tight vessel availability across key bulk classes, combined with heightened insurance premiums linked to sanctions exposure and Middle East war-related risk, materially increased landed costs. These dynamics transformed freight from a passive input into an
active mechanism of price enforcement, particularly on CFR-based markets.
This shift explains why urea prices continued to advance despite selective demand:
markets no longer cleared on price alone, but on execution capacity.
Source: Baltic Exchange – Dry Bulk & Fertilizer Freight
5.2 Route-Specific Pressure – Persian Gulf as the Epicenter
Freight escalation was most pronounced on routes originating from the Persian Gulf, where geopolitical risk perception, insurance adjustments, and port congestion converged. Key urea export corridors—including Persian Gulf to Brazil and Persian Gulf to South Asia—saw freight rates rise throughout the month.
Even modest nominal freight increases translated into
a significant impact on CFR, given already elevated FOB levels. In several cases, freight alone accounted for the difference between viable and non-viable buying decisions, effectively setting
hard CFR price floors independent of producer pricing strategy.
This environment reduced arbitrage flexibility and discouraged opportunistic buying, reinforcing seller leverage across export origins.
Source: Baltic Exchange; Armaiti MEX Freight Assessments; Green Gubre Group analysis
Figure 7 – Urea Freight Escalation and CFR Price Enforcement
Source: Baltic Exchange; Armaiti MEX; Green Gubre Group synthesis
5.3 Port Congestion and Execution Risk
Freight pressure in January was compounded by persistent congestion at both loading and discharge ports. Jetty congestion, anchorage delays, and slow discharge rates—evident in Iranian ports—reduced effective vessel turnaround and absorbed available tonnage.
As a result, freight tightness was not solely a function of vessel count, but of
time inefficiency. Each additional day spent at anchorage or awaiting berth reduced system-wide capacity, magnifying freight pressure even in the absence of new cargo demand.
This execution risk translated directly into pricing behavior. Buyers are increasingly factoring freight uncertainty into procurement decisions, reinforcing an upward bias in CFR negotiations.
Source: World Bank – Maritime Logistics & Trade Disruptions
Table 7 – Freight Market Drivers and Impact on Urea Pricing (January 2026)
| Freight Driver | Market Effect | Pricing Consequence |
|---|---|---|
| Vessel availability | Tight | Higher base freight |
| Geopolitical risk | Elevated insurance | Risk premium embedded |
| Port congestion | Reduced turnaround | Capacity compression |
| Sanctions exposure | Route re-pricing | CFR floor enforcement |
| Execution uncertainty | Buyer caution | Reduced arbitrage |
Source: Baltic Exchange; World Bank; Green Gubre Group analysis
5.4 Strategic Interpretation
In January 2026, it was confirmed that freight had become a price-setting variable rather than merely a cost input. Once logistics capacity and vessel availability became constrained, traditional demand signals lost explanatory power. Prices rose not because buyers chased material, but because material could not move freely.
For urea exporters, freight conditions reinforced disciplined selling strategies. For importers, the month highlighted the risk of delayed procurement in environments where logistics—not production—are the limiting factor.
Freight thus functioned as the
final enforcement layer in January’s structurally tight fertilizer market, linking geopolitical risk, port congestion, and pricing into a single constraint-driven system.
6. Geopolitics and War Impact (Middle East) – January 2026
6.1 From Shock Risk to Structural Premium
Ongoing war conditions in the Middle East continued to shape fertilizer market dynamics throughout January 2026, not through direct production disruptions, but through persistent increases in geopolitical risk perception. Fertilizer production across the region remained operational, and no major export outages were recorded. However, markets increasingly treated geopolitical risk as a structural cost rather than a temporary shock.
mUnlike earlier conflict phases—where markets reacted with abrupt volatility spikes—January pricing behavior reflectedrisk normalization. Insurance premiums, freight availability constraints, and operational caution were consistently priced into transactions, reinforcing price stability rather than triggering panic-driven moves.
This evolution marked a shift from event risk to embedded risk, fundamentally altering how markets assessed Middle East-origin supply
Source: World Bank – Geopolitical Risk & Commodities
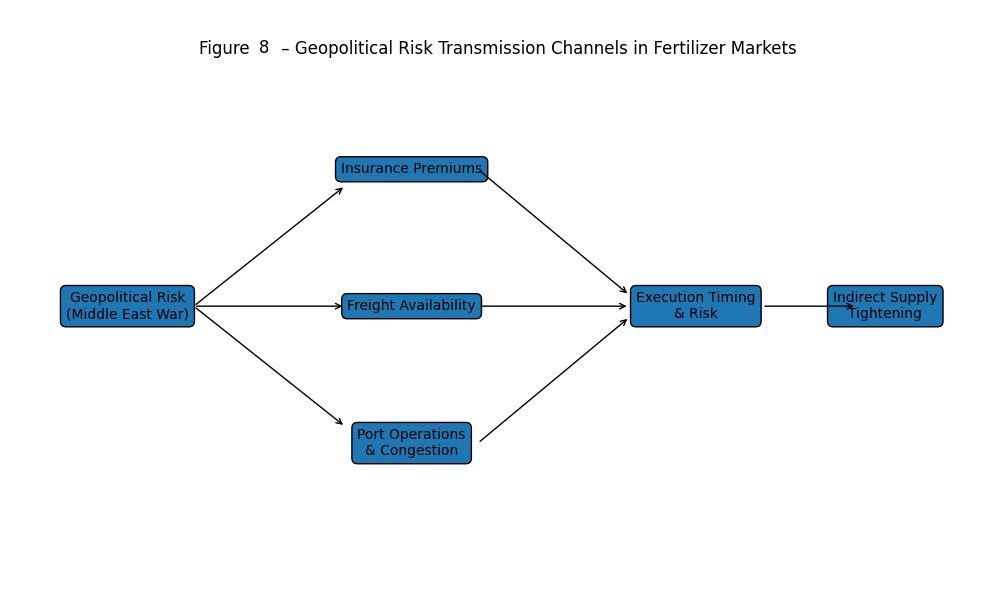
6.2 Insurance, Freight, and Operational Friction
The most tangible transmission channels of geopolitical risk were marine insurance costs, vessel routing decisions, and charterer behavior. War-related uncertainty increased risk premiums on voyages transiting sensitive corridors connected to the Middle East, particularly those linked to the Persian Gulf.
nThese premiums did not fluctuate daily; instead, theyreset baseline freight economics upward, contributing to tighter vessel availability and higher landed costs. Importantly, these effects persisted even during periods of limited spot demand, underscoring that logistics friction—not buyer behavior—was driving market outcomes.
Operational planning also became more conservative. Producers, traders, and charterers increasingly prioritized execution certainty over marginal price optimization, reducing speculative flows and reinforcing disciplined selling strategies
Source: World Bank – Transport Risk & Trade Flows
Figure 8 – Geopolitical Risk Transmission Channels in Fertilizer Market
Source: World Bank; Green Gubre Group synthesis
6.3 Market Behavior – Stability Over Volatility
Contrary to historical precedents, January 2026 demonstrated that heightened geopolitical risk did not translate into price spikes. Instead, markets responded with price firmness and reduced downside flexibility. This behavior confirms that participants were not reacting emotionally to headlines but rationally adjusting cost structures and execution expectations.
Urea, sulphur, and phosphate markets all reflected this pattern:
- Prices held or advanced modestly
- Volatility remained contained
- Downside corrections were limited despite selective demand.
This outcome reinforces the conclusion that war-related risk had become a structural market parameter, influencing price floors rather than short-term momentum.
Source: FAO – Fertilizer Market Context
Table 8 – Direct vs Indirect War Impact on Fertilizer Markets (January 2026)
| Impact Channel | Direct Effect | Indirect Effect | Market Outcome |
|---|---|---|---|
| Production | Minimal | None | Supply continuity |
| Exports | Stable | Execution caution | Reduced flexibility |
| Insurance | None | Higher premiums | Cost floor support |
| Freight | None | Vessel tightening | CFR price enforcement |
| Sentiment | Controlled | Risk normalization | Stability over volatility |
Source: World Bank; FAO; Green Gubre Group analysis
6.4 Strategic Interpretation
January 2026 confirmed that Middle East war conditions had transitioned from a volatility trigger into a structural cost and risk layer embedded in fertilizer markets. Rather than amplifying price swings, geopolitical risk reinforced disciplined behavior across supply chains, supporting stable and elevated price levels.
For market participants, this shift carries a clear implication:
In structurally tight markets, geopolitical risk strengthens price floors more than it fuels rallies.
This environment favors actors with strong logistics access, insurance capability, and execution discipline, while penalizing speculative positioning and delayed procurement strategies.
9. Outlook – Q1 to Q2 2026
9.1 Macro Positioning – Volatility Within Structural Support
Entering Q2 2026, global fertilizer markets are expected to remain volatile in execution but structurally supported in price formation. The correction cycle that dominated November 2025 has clearly ended, and markets are now operating within a framework defined by logistics constraints, cost floors, and embedded geopolitical risk, rather than demand-driven price discovery.
Price direction across nutrients will likely remain
asymmetric: upside potential exists during periods of logistical stress or procurement concentration, while downside risk is limited by elevated freight and insurance costs, as well as upstream input economics. As a result, price movements are expected to be
stepwise rather than trendless, with consolidation phases punctuated by episodic repricing.
Source: International Fertilizer Association (IFA) – Global Market Outlook
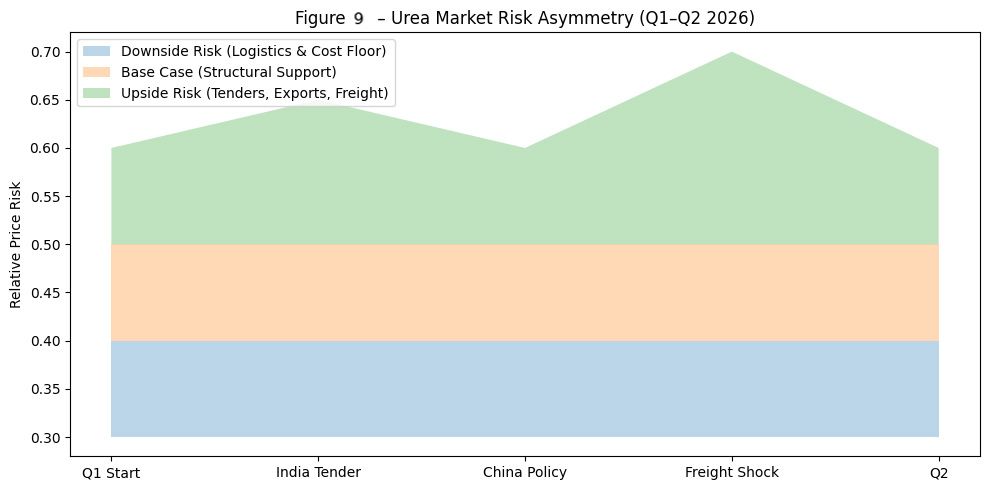
9.2 Urea – Event-Driven Risk with Structural Floor
Urea markets are expected to remain the most reactive segment of the fertilizer complex through Q1–Q2 2026. Price behavior will hinge on a few high-impact variables rather than on broad demand recovery.
Key drivers include:
- India’s procurement timing, which continues to act as a global price catalyst rather than a volume absorber
- China’s export management, particularly policy signaling around quota flexibility
- Persistence of logistics congestion, especially in Middle East export corridors and Atlantic Basin routes
While volatility around tenders and policy announcements is likely, downside risk remains constrained. Elevated freight costs and execution risk make it increasingly challenging to sustain sub-structural price levels, even during demand pauses.
Source: IFA; ICIS – Urea Market Outlook
Figure 9 – Urea Market Risk Asymmetry (Q1–Q2 2026, Conceptual)
Source: IFA; ICIS; Green Gubre Group synthesis
9.3 Ammonia – Stability Extending into Early Q2
Ammonia pricing is expected to remain firm into early Q2 2026, supported by contract structures, limited spot liquidity, and persistent energy cost pressure. Unlike urea, ammonia markets are unlikely to experience sharp price movements unless disrupted by major energy shocks or unexpected production outages.
Ammonia's stability will continue to provide a
cost anchor for downstream nitrogen products, limiting the scope for aggressive discounting across the fertilizer chain. Any adjustment is expected to be gradual and contract-led rather than market-driven.
Source: ICIS – Ammonia Market Outlook
9.4 Sulphur and Phosphates – Gradual Normalization, Not Recovery
Sulphur and phosphate markets are expected to continue along a measured normalization path through Q1–Q2 2026. The extreme tightness observed in late 2025 has eased, but elevated cost structures and disciplined supply behavior prevent sharp corrections.
For sulphur, normalization will remain constrained by phosphate-linked demand and by competition for logistics at key ports. For phosphates, elevated ammonia and sulphur input costs will continue to enforce price floors, even as India and Brazil maintain selective buying strategies.
Neither market is positioned for rapid recovery, but equally, neither shows conditions consistent with structural weakness.
Source: FAO; ICIS – Phosphates & Sulphur Outlook
Table 9 – Outlook by Nutrient (Q1–Q2 2026)
| Product | Price Bias | Volatility | Key Risk Drivers |
|---|---|---|---|
| Urea | Firm with spikes | High | India tenders, China exports, freight |
| Ammonia | Firm | Low | Energy costs, contract renewals |
| Sulphur | Normalizing | Moderate | Phosphate demand, logistics |
| Phosphates | Stable | Low | Input costs, selective demand |
Source: IFA; FAO; ICIS; Green Gubre Group analysis
9.5 Freight and Geopolitics – Persistent Risk Asymmetry
Freight and geopolitics are expected to remain structural variables rather than episodic risks through Q2 2026. Vessel availability, insurance premiums, and port congestion—particularly linked to Middle East trade flows—will continue to define execution risk and price floors.
Rather than amplifying volatility, these factors are likely to
limit downside flexibility, reinforcing the asymmetric risk profile observed in January 2026. Markets are expected to price geopolitical risk as a
persistent cost layer, not a temporary disturbance.
Source: World Bank – Commodity Markets Outlook
9.6 Strategic Takeaway
The Q1–Q2 2026 outlook confirms a market environment where discipline outweighs demand, and execution capacity outweighs theoretical availability. Fertilizer markets are unlikely to revert to pre-2025 price dynamics in the near term.
For market participants, the strategic implication is clear:
Success in Q2 2026 will depend less on predicting demand and more on managing logistics, timing procurement, and controlling execution risk.
Source: International Fertilizer Association (IFA) – Global Outlook
Conclusion
January 2026 marked a decisive structural inflection point in global fertilizer markets. The month confirmed the transition from the post-correction stabilization observed in December 2025 to a phase of logistics-constrained price escalation, in which execution capacity—not marginal demand—became the dominant determinant of market outcomes.
Unlike speculative rallies driven by sentiment or paper positioning, January’s price advances werephysically validated. Persistent port congestion, tight vessel availability, elevated freight and insurance costs, and disciplined producer behavior collectively reduced adequate supply elasticity across nutrients. As a result, prices advanced and consolidated at higher levels despite selective and cautious end-user demand.
This shift fundamentally altered the mechanics of price discovery. Markets no longer cleared through price alone; they are removed throughlogistics availability, execution timing, and risk tolerance. Urea absorbed the most significant volatility due to its exposure to freight and tender-driven demand, while ammonia remained firm as the cost anchor of the nitrogen complex. Sulphur and phosphates entered controlled normalization phases, supported by upstream cost floors and constrained logistics rather than demand recovery.
Geopolitical conditions in the Middle East further reinforced this environment. While fertilizer production and exports remained operational, war-related risk was increasingly priced as astructural premium embedded in freight, insurance, and operational planning. This risk normalization supported price stability rather than amplifying volatility, favoring disciplined supply chains over opportunistic trading.
Taken together, January 2026 confirmed that fertilizer markets have entered a regime in whichdownside flexibility is structurally limited, and upside risk materializes episodically through logistics disruptions, procurement concentration, or geopolitical escalation.
For market participants, the implication is clear
Competitive advantage in 2026 will be driven less by forecasting absolute price direction and more by controlling execution risk, logistics visibility, and geopolitical exposure.
Source: World Bank – Commodity Markets Outlook
Table 10 – January 2026: Structural Takeaways Across the Fertilizer Comple
| Dimension | Key Observation | Last Name |
|---|---|---|
| Market regime | Post-correction → structural tightness | Prices supported even with selective demand |
| Price driver | Logistics & execution | Demand no longer sets the marginal price |
| Urea | Volatile but floor-supported | Event-driven upside, limited downside |
| Ammonia | Firm, contract-driven | Cost anchor for nitrogen chain |
| Sulphur | Normalizing, not correcting | Logistics & phosphate demand protect downside |
| Phosphates | Stable, cost-anchored | Input costs override demand softness |
| Freight | Binding constraint | CFR floors enforced |
| Geopolitics | Structural premium | Stability > volatility |
| Risk profile | Asymmetric | Downside capped, upside episodic |
Source: World Bank; IFA; ICIS; Baltic Exchange; Green Gubre Group synthesis
References & Data Sources
- Argus Media – Global Fertilizer & Petrochemical Pricing
- CRU Group – Fertilizers & Metals Market Analysis
- Armaiti Mercantile Exchange (Armaiti MEX) – Daily Fertilizer & Freight
- International Fertilizer Association (IFA) – Global Fertilizer Market Intelligence
- World Bank – Commodity Markets Outlook & Input Cost Analysis
- FAO – Fertilizer Statistics & Global Nutrient Trade
- Trading Economics – Fertilizer, Urea & Sulphur Price Indicators
- ICIS – Market Intelligence
- Baltic Exchange – Dry Bulk & Fertilizer Freight Indices
- European Commission – CBAM & Fertilizer Regulatory Framework
- USDA Agricultural Marketing Service (AMS) – Fertilizer Market Reports