November 2025
Fertilizer & Petrochemical Market Report
Comprehensive analysis of global fertilizer and petrochemical markets in November 2025, including urea, ammonia, sulphur, phosphates, freight, and market outlook.
Author : Saman Memarpour
Executive Summary
November 2025 marked a decisive shift in global fertilizer and petrochemical dynamics, with pricing, liquidity, freight, and trade flows reshaped by events in India, China, Europe, and the Middle East. The month began with relative stability but quickly transitioned into a period of synchronized correction across nitrogen and phosphate markets, alongside a powerful rally in sulphur and continued tightness in ammonia. These developments occurred against a backdrop of volatile energy markets, shifting geopolitical pressures, and lower-than-expected demand in major consuming regions, including Brazil, Southeast Asia, and the United States
.Reference:
World Bank – Commodity Markets Outlook
A defining event wasIndia’s large November urea tender, awarded at
USD 418–420 CFR, significantly below market expectations. This single procurement cycle set the global ceiling for CFR prices and forced a broad realignment in FOB values from the Middle East, North Africa, China, and the Black Sea. The tender also reduced short-term demand visibility, as India secured sufficient volumes to cover a substantial portion of its Q1 2026 requirements, prompting sellers worldwide to lower their offers.
Reference:
Trading Economics – Urea Prices
At the same time,China re-entered the export market with a tightly controlled
600,000-ton quota, introducing new competitive pressure into an already softening global environment. Although Chinese tons were fragmented across smaller allocations and faced logistical bottlenecks, the psychological impact on global pricing was immediate—buyers expected more supply. At the same time, sellers struggled to maintain offer levels in the Middle East and the Black Sea.
Reference:
FAO Fertilizer Statistics Database
TheBrazilian market weakened sharply, with CFR values falling from the high USD 420s into the USD 390s by mid-to-late November. This decline was driven by currency depreciation, subdued import demand, and higher inventories held by key distributors and blenders. Seasonal demand was also weaker than average, with many Brazilian buyers postponing purchases in expectation of further declines following India’s tender and China’s re-entry.
Reference:
International Fertilizer Association (IFA)
In contrast,European buyers remained active, rushing to secure urea, nitrates, and UAN ahead of the
CBAM implementation scheduled for January 2026. This created an unusual divergence: while global markets turned bearish, Europe supported elevated FOB values from Egypt and Algeria, with some transactions reaching USD 500–507 FOB before easing later in the month.
Reference:
European Commission – Carbon Border Adjustment Mechanism (CBAM)
The ammonia market experienced aglobal shortage, driven by
Trinidad shutdowns, US Gulf production constraints, and strong downstream demand from industrial and fertilizer producers. FOB Middle East ammonia surged to
USD 530, with price stability in Europe and the US Gulf maintained due to limited spot availability.
Reference:
ICIS – Ammonia Market Overview
In sulphur,prices rallied aggressively, supported by
Russia’s continued export restrictions, Middle East maintenance, and firm demand from phosphate producers in China and Indonesia. China’s domestic sulphur prices climbed to multi-year highs, reinforcing bullish sentiment and widening the import arbitrage.
Reference:
TradingView – Global Sulphur Price Chart
Phosphate markets—particularlyDAP and MAP—moved in the opposite direction. India reduced DAP intake, Brazil deferred MAP purchases, and China maintained tight export controls. Prices fell across most major regions despite elevated input costs from sulphur and ammonia, signaling demand weakness and oversupply fundamentals.
Reference:
FAO – Phosphate Fertilizer Market Report
Freight markets stabilized in November, with slight declines on the Middle East–Brazil, ME–US Gulf, and China–India routes, driven by improved vessel availability. However, the Baltic and Black Sea regions remained structurally tight due to winter season constraints and longer transit times to key markets
.Reference:
Baltic Exchange – Freight Market Indicators
Overall, the November 2025 landscape can be summarized as
- Bearish: Urea, phosphates
- Bullish: Ammonia, sulphur
- Stable but tight: Freight
- Regionally divergent: Europe remained strong; Brazil weakened; India anchored global prices; China introduced uncertainty with export management.
1. NITROGEN – UREA MARKET (November 2025)
1.1 Global Urea Price Overview
November 2025 was one of the most structurally significant months for the global urea market in recent years. The combination of India’s pivotal tender, China’s carefully controlled export allocation, weak Brazilian demand, and Europe’s aggressive pre-CBAM purchasing shaped a month of high volatility, rapid price realignments, and sharp inter-regional divergence.
wGlobal supply/demand balance shifted materially after mid-month as India locked in 1.56 Mt atUSD 418–420 CFR, defining the effective global ceiling for CFR prices and abruptly halting upward momentum in the Middle East and North Africa. China’s export reactivation further accelerated price softening across FOB markets, while Brazil—the largest CFR market—showed acute liquidity weakness, amplifying downside pressure.
The multi-source consolidated prices below are derived from Argus Nitrogen (4 weekly issues), CRU Fertilizer Week, Armaiti Daily Market Reports (24 photos), the Marlen Group November chart, and the
Weekly Price Summary (13 Nov).
Reference:
World Bank – Commodity Markets Outlook
Global Urea Price Table (USD/MT, Bulk/Granular)
| Region | Early Nov | Mid Nov | Late Nov | Trend | Market Interpretation |
|---|---|---|---|---|---|
| Middle East FOB | 415-417 | 405-412 | 398-405 | ↓ Bearish | India tender reduces netbacks; sellers struggle to defend 410 |
| Iran FOB | 372-377 | 375-380 | 370-378 | → Soft | Iran trades attractively, but freight premiums limit competitiveness |
| Egypt FOB | 465-485 | 495-505 | 455-470 | ↓ Sharp | Europe-supported rally collapses after mid-month |
| China FOB | 395-405 | 405-410 | 400-405 | → Stable | Controlled quota keeps floor firm but limits upside |
| Brazil CFR | 425-430 | 410-420 | 393-399 | ↓ Strong | Brazil becomes the weakest link due to low liquidity |
| India CFR | 395-402 | 418-420 | 418 | ↑ then flat | Tender sets a global ceiling and halts price escalation |
| US Gulf FOB | 398 | 388 | 365-370 | ↓ Consistent | Weak domestic demand and declining river values |
| Black Sea FOB | 430-435 | 430-445 | 420-432 | → Softening | Asia-led correction hits Black Sea producers |
Reference: Trading Economics – Urea Index
1.2 Visual Price Trends
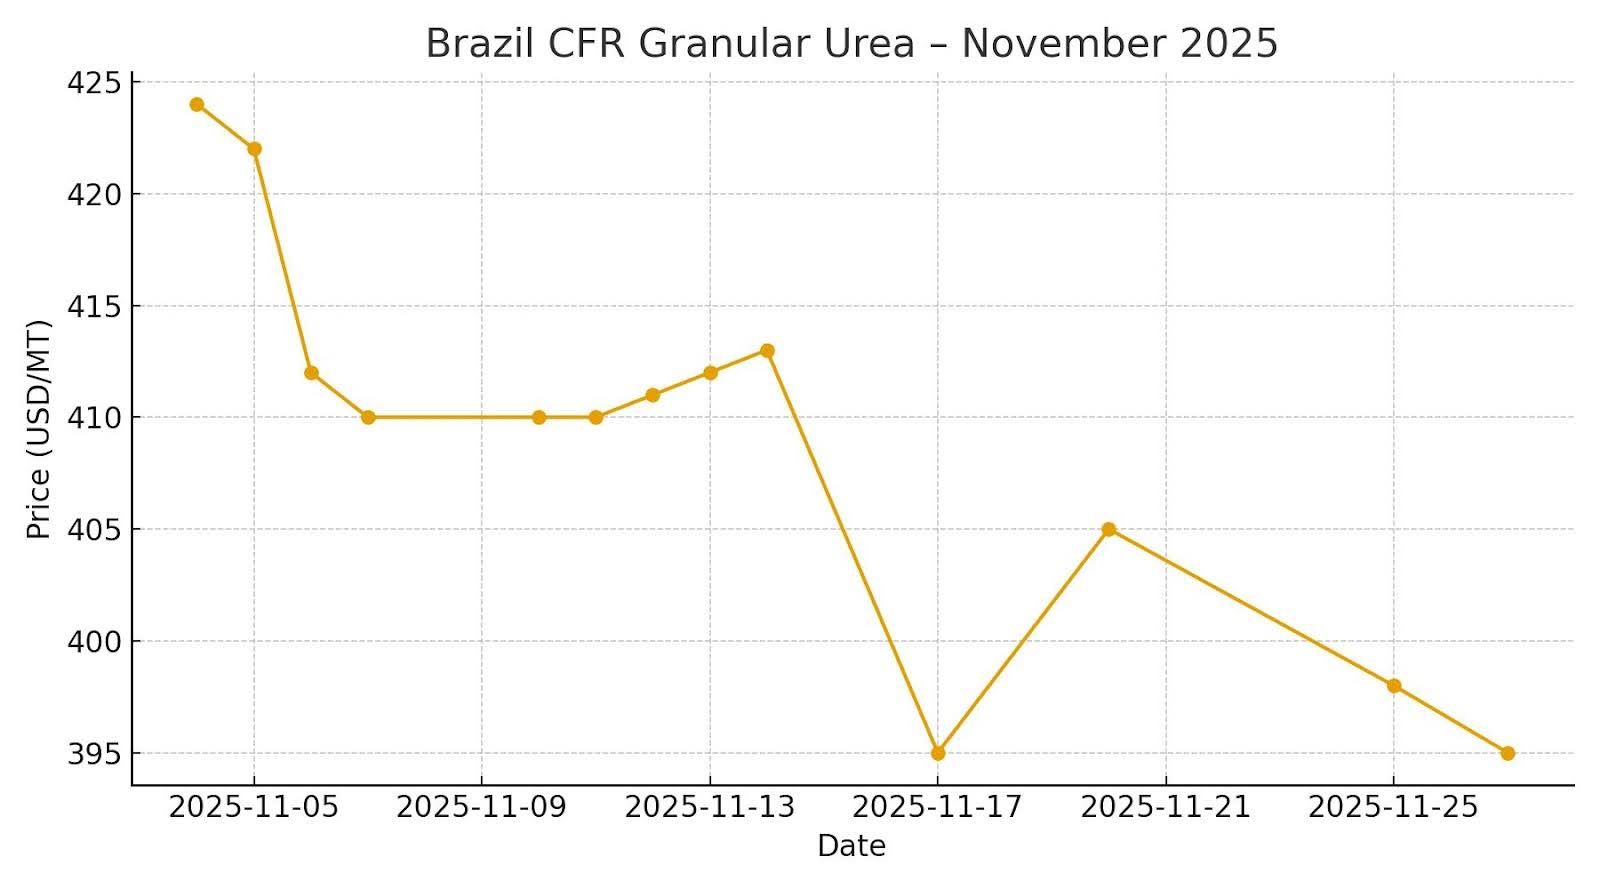
Brazil CFR – November Price Decline
Brazil’s CFR market experienced the steepest decline among major regions, dropping by nearly USD 30–35/MT over three weeks. This was driven by a weak BRL, cautious importers, and China’s re-entry.
Reference:
IFA – Fertilizer Market Trends
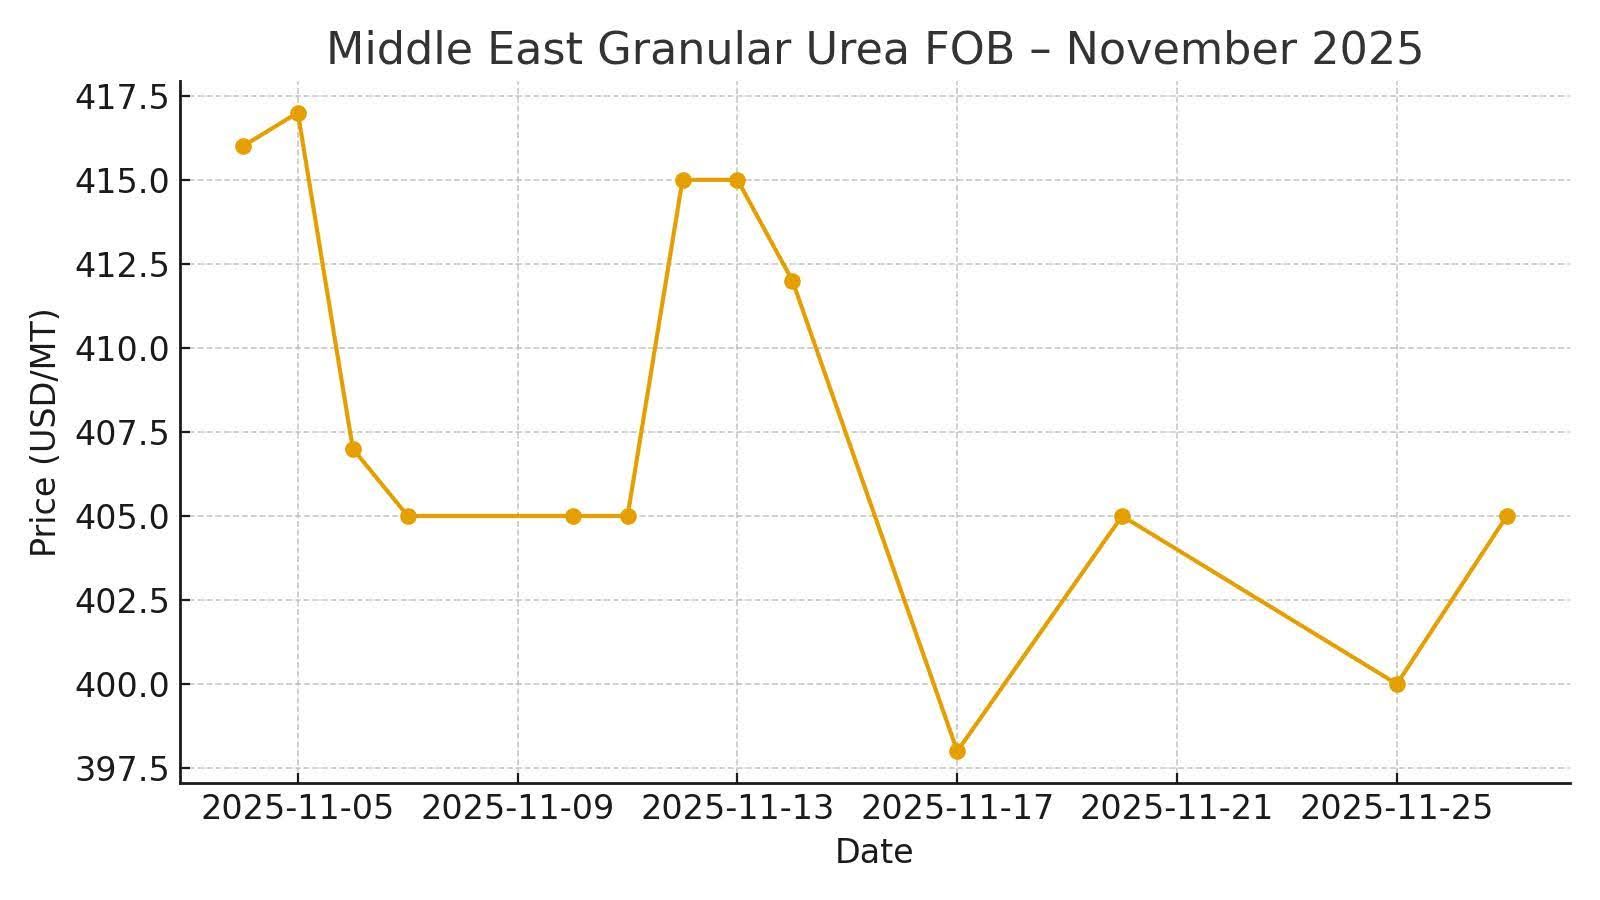
Middle East FOB – Post-Tender Downtrend

The Middle East granular urea market experienced a decisive sentiment reversal in November 2025, triggered primarily by India’s unexpectedly low tender result. Early in the month, producers were confident they could maintain a USD 415–417 FOB floor, supported by stable demand from Europe and scattered inquiries from Latin America and Africa. However, this stability collapsed after India awarded its 1.56 Mt tender at USD 418–420 CFR, significantly reducing netbacks and forcing Middle Eastern suppliers to reassess their offer levels immediately.
As traders recalculated post-tender realizations, market resistance intensified. Buyers in Brazil, Southeast Asia, and Turkey quickly rejected offers aboveUSD 410, anticipating additional downward pressure from China’s renewed export activity and weakening CFR benchmarks globally. By mid-November, transactional levels typically ranged from
USD 405 to 412 FOB, signaling the end of the early-month firmness.
The market softened further toward month-end as additional Chinese prilled parcels entered the market, freight rates eased slightly on ME → Brazil and ME → US Gulf routes, and sentiment deteriorated in Brazil—one of the Middle East’s key demand drivers. By November 17, the Armaiti daily reports and Argus assessments aligned atUSD 398–405 FOB, marking a near-USD 15–20 decline from the month’s initial highs.
Fundamentally, the region moved from a position of strength to one of defensive pricing within three weeks. The combination of
- India’s tender ceiling,
- China’s quota-driven export relief,
- Soft Brazilian liquidity, and
- Easing freight markets,
Created an environment in which Middle Eastern producers were no longer able to defend the psychologically important USD 410 level. This re-pricing also reshaped global flows, making the Middle East more competitive relative to Iran and the Black Sea, and re-establishing it as the marginal price setter for CFR markets into early December 2025.
Reference:
FAO – Fertilizer Statistics Portal
US Gulf FOB – Weakest Major Market in November
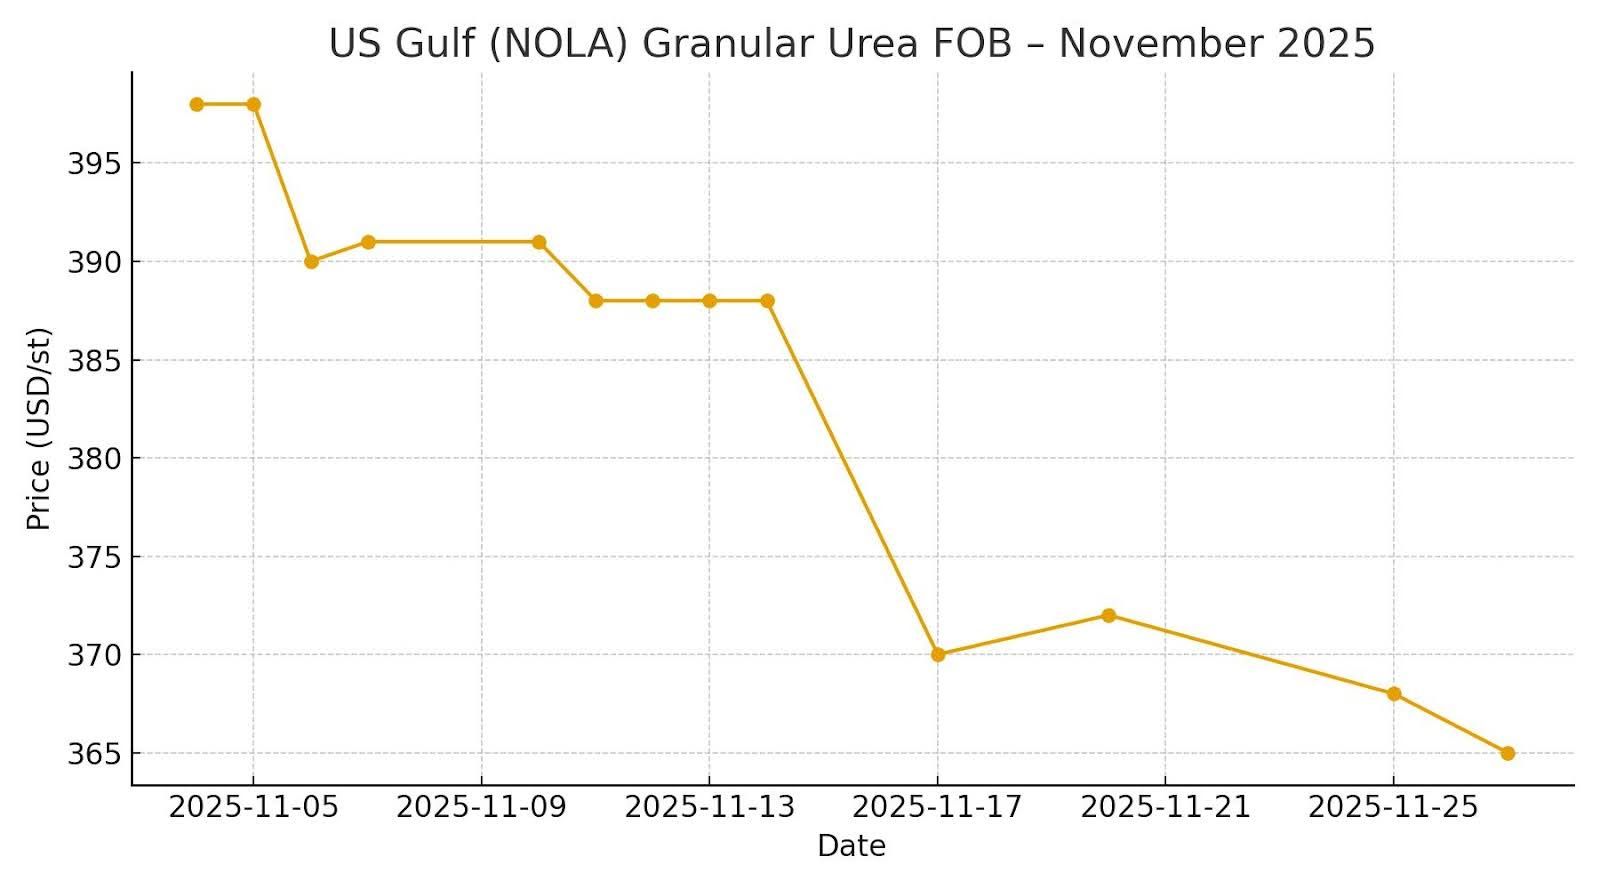
The US Gulf (NOLA) urea market stood out as the weakest-performing primary global market in November 2025, with a sustained, uninterrupted downward trend throughout the month. Early November values around USD 398/st quickly lost momentum as domestic demand remained muted and no seasonal catalyst emerged to absorb product already sitting in river terminals.
A combination of soft agricultural demand, mild weather across the core Midwest, and robust inventories across retail distribution channels prevented any meaningful price recovery. With farmers delaying applications and wholesalers prioritizing inventory reduction ahead of year-end, urea faced a structural lack of buying pressure during a period that typically brings some winter-prep purchasing. This absence of farmgate pull led river and barge markets to trade in increasingly narrow, downward-biased ranges
.The pressure intensified mid-month after theIndian tender fixed global CFR at USD 418–420, dragging global sentiment lower. As international CFR benchmarks weakened, traders reduced their bids for imported urea into coastal terminals. Simultaneously, Brazilian CFR values falling toward the
USD 395/MT range eliminated any export-driven arbitrage opportunities from the US Gulf, further depressing demand from traders.
By mid-November, barge assessments slipped toUSD 370–372/st, with some distressed transactions reportedly clearing even lower as sellers sought liquidity. By the final week of November, US Gulf granular urea was assessed at
USD 365–370/st, marking one of the steepest regional month-over-month corrections globally.
The US Gulf’s weakness has broader implications
- It undercut ME and Iran’s netbacks, contributing to global bearishness.
- It signaled weak end-user demand heading into winter.
- It reinforced expectations of continued pressure into early December unless weather or export economics shift materially.
Reference: USDA – Fertilizer Price Dashboard
1.3 Regional Market Insights
Persian Gulf – Market Loses Steam After India Tender
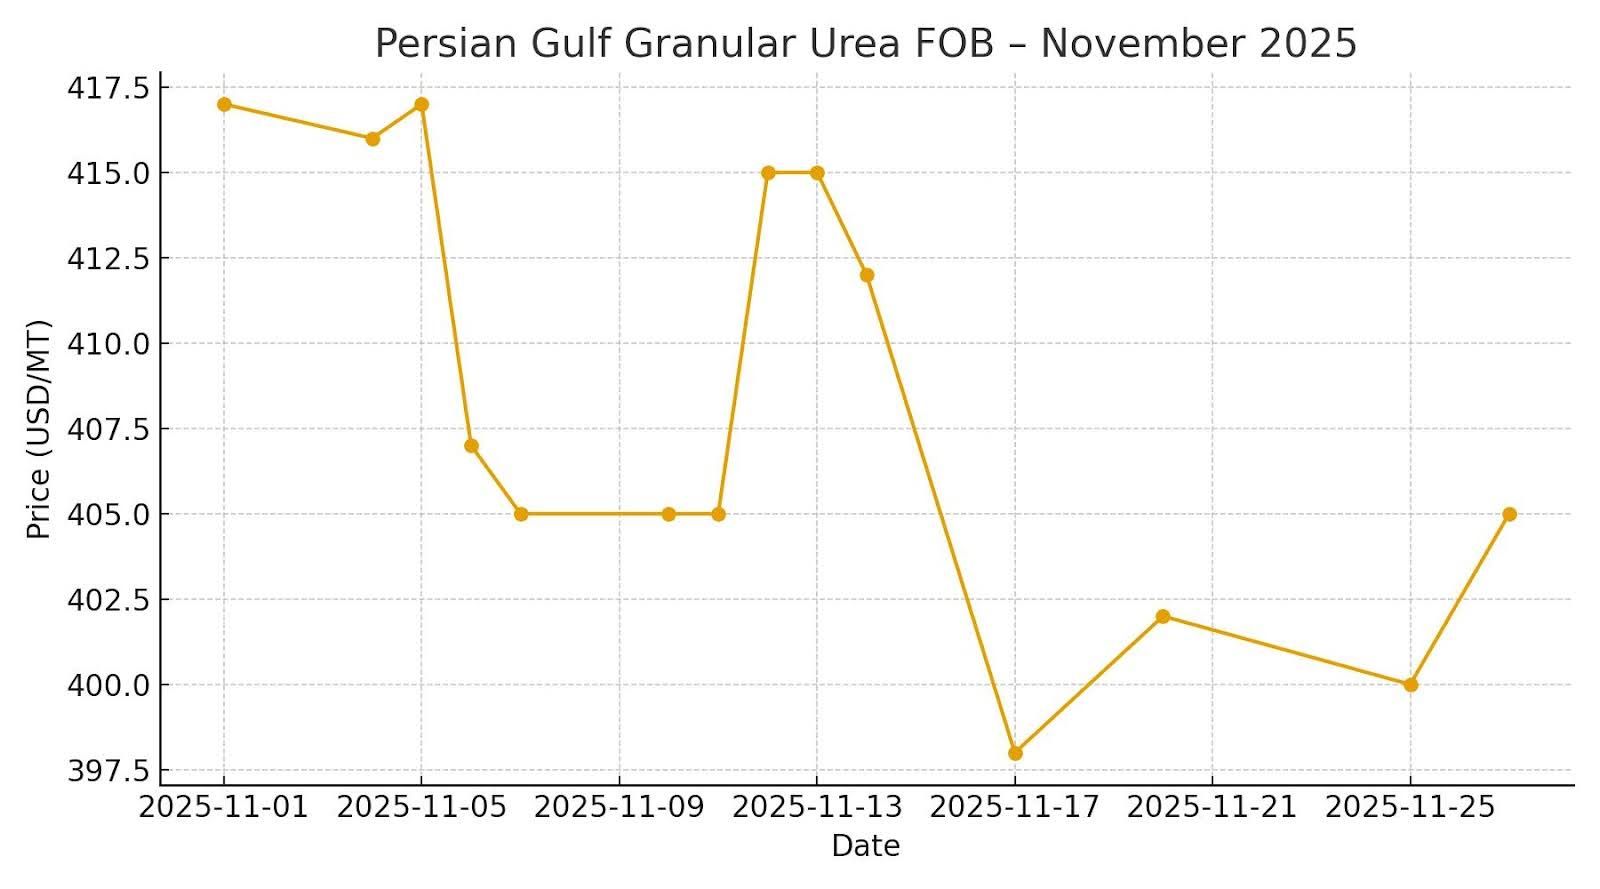
The Persian Gulf urea market, traditionally the world’s most influential origin for granular urea, began in November 2025 with a strong upward bias. Early-month sentiment was supported by robust pre-CBAM European buying, solid inquiries from North and West Africa, and limited turnarounds among regional producers. These dynamics allowed Persian Gulf FOB values to stabilize around USD 415–417, levels producers were confident they could defend due to healthy demand across Mediterranean and western Asian outlets.
The inflection point arrived mid-month when
India’s state trading companies awarded their tender at USD 418–420 CFR, significantly below market expectations. Because India is the most critical buyer of Persian Gulf granular urea, the netback calculation immediately pushed realizations into the
USD 400–405 FOB range. This removed the month’s bullish foundation and rapidly shifted negotiation power to buyers.
Throughout the second week of November, producers initially resisted the drop, maintaining
USD 410–412 FOB offers based on strong early-month sales into Europe. However, importers—particularly in Brazil, East Africa, and Southeast Asia—recognized the implications of the tender and withdrew at lower bid levels. This mismatch created a rapid market correction, with several traders reporting failed offers and cancelled negotiations as sentiment reset downward.
Additional pressure came from China's re-entry into the export market through controlled prilled urea allocation. Even though logistical bottlenecks slowed actual Chinese outflows, the expectation of more tons entering the market undermined seller leverage in the Persian Gulf. By November 17, multiple daily reports (Armaiti), combined with Argus and CRU assessments, aligned Persian Gulf granular urea values at
USD 398–405 FOB, representing a
USD 12–18 decline from early-month highs.
By late November, freight softening on the
Persian Gulf → Brazil (21–23 USD/MT) and
Persian Gulf → US Gulf (32–34 USD/MT) routes improved netbacks slightly, but not enough to reverse market sentiment. The region ended the month under mild downward pressure, with December trading expected to remain muted unless India signals new import requirements or Chinese exports slow materially.
Reference:
Baltic Exchange – Global Freight & Fertilizer Indicators
Iran – Competitive FOB but Challenged by Freight & Sanctions
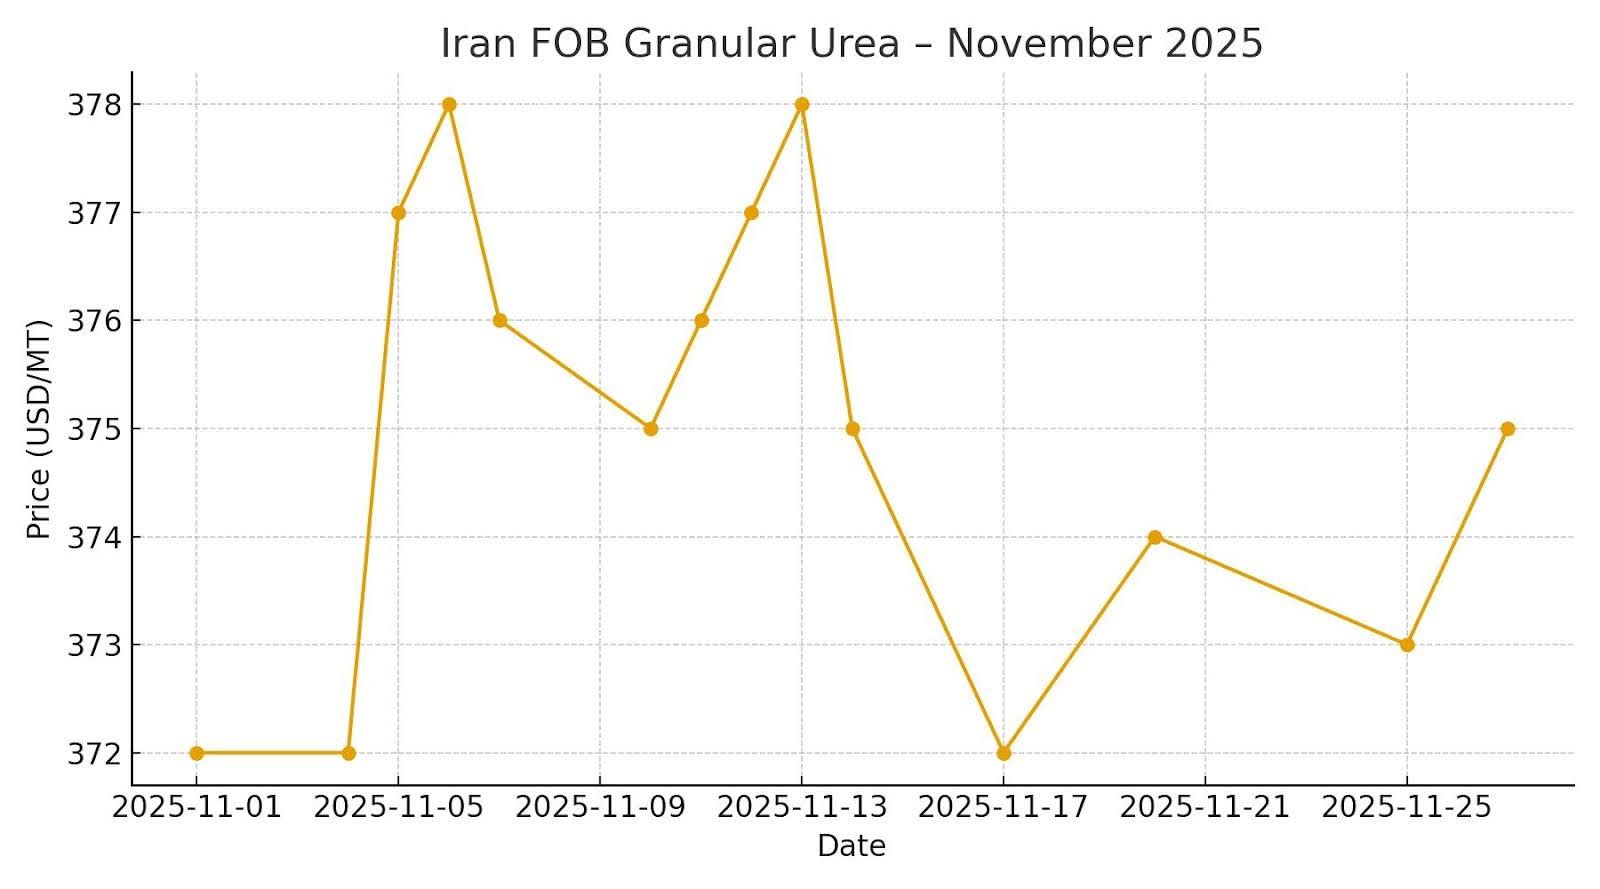
Iran remained one of the most competitively priced granular urea exporters during November 2025, consistently offering some of the lowest FOB levels globally. Iranian granular urea is primarily traded within the USD 371–380/MT FOB range, occasionally touching the upper USD 383–385 levels when global sentiment strengthened around mid-month. Despite this inherent pricing advantage, Iran continued to face structural barriers that limited its ability to capitalize on global demand fully.
A significant factor suppressing Iran’s competitiveness is the
sanction-linked freight premium, which typically adds
USD 5–12/MT above equivalent routes from the Persian Gulf or North Africa. This premium arises from higher risk pricing by shipowners, insurance restrictions, and the fleet's reduced willingness to call at Iranian ports. Even when Iranian FOB prices undercut Persian Gulf offers by USD 10–15/MT, these freight add-ons often neutralize the advantage when calculating CFR values for destinations such as Brazil, Turkey, East Africa, and Southeast Asia.
The market also faced
limited vessel availability, especially for Handy and Supramax sizes, which are commonly used for Iranian shipments. Tighter vessel supply throughout November—partly due to geopolitical risks and partly because operators favored less-restricted ports—created logistical bottlenecks. This often resulted in delayed loadings or forced traders to accept smaller lots, limiting Iran’s ability to win larger tenders or long-haul cargoes.
Furthermore, buyer psychology following India’s November tender favored
Persian Gulf-origin cargoes, as they provided more predictable shipping timelines and clearer financing channels. Even though Iranian producers attempted to raise offers to
USD 380–385 FOB, importers in key markets such as
Brazil and
Turkey rejected these higher levels, citing logistics risks and better-timed offers from neighboring origins. As a result, Iran sold primarily during opportunistic windows, in small parcels, and to regions with flexible freight terms.
Despite these obstacles, Iran maintained a stable presence in the global supply chain, particularly in shorter-haul regional markets, where freight disadvantages are minimized. Its structural pricing edge ensures that the Iranian product continues to play a pivotal role in setting the lower boundary for global granular urea FOB levels — even when sanctions and transportation headwinds prevent full participation in key long-haul markets.
Reference:
UN Comtrade – Fertilizer Trade Data
Brazil – Weakest Market Globally in November
Brazil remained the weakest global urea market throughout November 2025, exerting substantial downward pressure on international CFR benchmarks. As the world’s largest granular urea importer, shifts in the Brazilian market have an outsized influence on global sentiment—and November was defined by a combination of economic, logistical, and seasonal factors that compounded to create the softest pricing environment seen since early Q2.
The depreciation of the Brazilian real (BRL) against the US dollar significantly reduced purchasing power, discouraging importers from taking positions even when nominal CFR prices began to fall. This currency-driven hesitancy was amplified by elevated interest rates in Brazil, which raised the cost of financing fertilizer inventories and made buyers more conservative—especially distributors already carrying higher-than-normal stock levels.
A second central pressure point was
freight cost increases, especially on long-haul routes from the
Persian Gulf to Brazil (21–23 USD/MT) and from
Iran to Brazil (36–39 USD/MT). These elevated freight levels offset the price advantages offered by some exporters and reduced Brazil’s willingness to commit to larger parcels. Meanwhile, the Indian tender set a global pricing ceiling. It encouraged Brazilian buyers to wait for further declines, firmly believing that sellers—particularly in the Persian Gulf—would need to lower their offers.
Seasonal demand patterns also contributed to the country’s subdued sentiment. November is traditionally a slower buying month for Brazil, positioned between peak agricultural cycles. With stocks still available in the domestic distribution chain, many importers chose to delay purchases until December or even early January, expecting to capture lower CFR values as global offers softened.
The result was a market in which CFR Brazil fell sharply from
USD 425–430/MT at the start of the month to
USD 393–399/MT by November 25. This nearly
USD 30–35/MT decline made Brazil the epicenter of global weakness and a key driver of price corrections across the Persian Gulf, Iran, the Black Sea, and China.
Because our company operates in Turkey—a strategic hub between Europe, the Mediterranean, and Latin America—Brazil’s bearish trend is significant. Its price behavior influences exporter netbacks from key competing regions, shaping our market intelligence and regional pricing strategies across both the Mediterranean Basin and West Africa.
Reference:
Trading Economics – Brazil Real (BRL)
India – The Price Setter for Global Urea
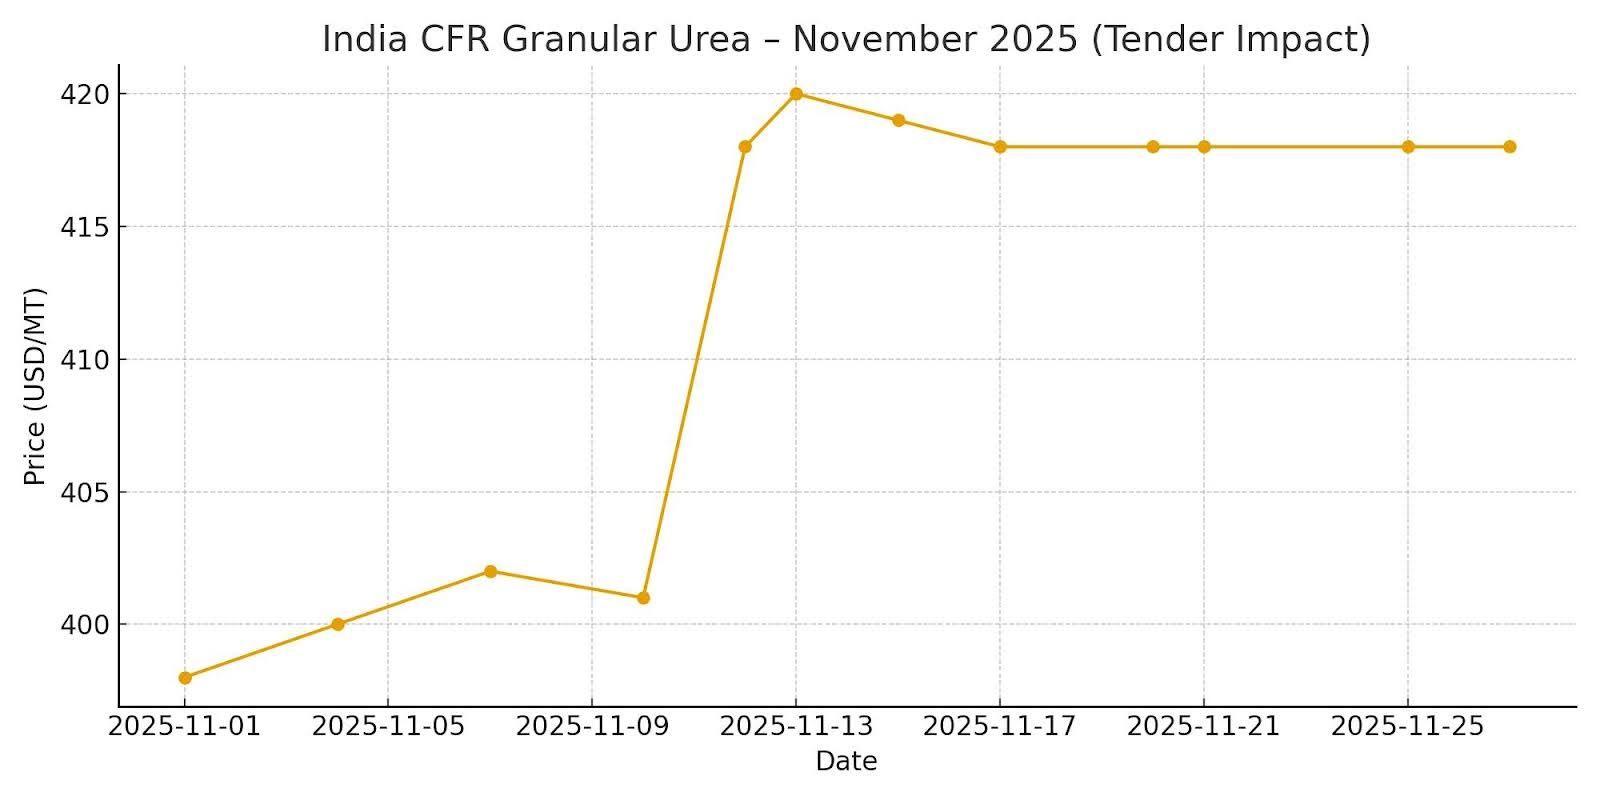
India remained the undisputed global price setter for granular urea in November 2025, exerting more influence on international markets than any other importing region. As the world’s largest spot buyer of urea—with procurement cycles that can reshuffle global trade flows within hours—India’s November tender shaped the trajectory of all major FOB and CFR markets for the remainder of the month.
In mid-November,
IPL (Indian Potash Ltd.) issued and awarded a tender for 1.56 million tonnes at USD 418–420 CFR, a result significantly below sellers' expectations, as they had positioned their offers earlier in the month at USD 430–440 CFR. This outcome triggered an immediate correction across the global market as traders recalculated netbacks and revised their buying interest accordingly.
Why the Tender Shocked the Market
| Period | India CFR (USD/MT) | Market Drivers |
|---|---|---|
| Early November | 395–402 | Soft demand, awaiting tender |
| Mid-November | 418–420 | Tender awarded (1.56 Mt) |
| Late November | 418 | Market anchored at the tender level |
Heading into the tender, many producers—especially in the Persian Gulf, Egypt, and China—anticipated a result closer to USD 430 CFR, supported by earlier purchasing activity from Europe and muted supply from China. When the tender settled at USD 418–420, it effectively reset global pricing, creating an unmistakable downward anchor for CFR values.
Cascading Impacts Across Region
The tender result caused several major shifts:
- It instantly set the global CFR ceiling, as no regional market could justify paying above the Indian award level.
- Producers’ netbacks declined by USD 10–20/MT, especially for shipments originating from the Persian Gulf and China.
- Several import-dependent regions paused their buying, anticipating broader price reductions over the next 10–15 days.
- China’s competitive prilled exports became even more potent as their pricing naturally fell below the Indian-equivalent CFR.
- Brazilian CFR values collapsed, dropping toward USD 395–399 CFR, as buyers revised price expectations downward.
The tender’s influence did not end with the award. For the rest of November, India’s USD 418 CFR level functioned as the global anchor, stabilizing CFR expectations across Asia, the Middle East, Africa, and Latin America. Even regions with traditionally higher CFR levels—such as East Africa or the Mediterranean—found their import economics tied to Indian tender sentiment.
For exporters, the message was unambiguous:
no primary market would pay more than India until December or early January unless freight, crop demand, or currency movements shifted dramatically.
Reference:
Government of India – Fertilizer Procurement Portal
United States (US Gulf) – Most Bearish Region in November

The
United States Gulf (NOLA) urea market emerged as the
weakest and most consistently bearish region globally in November 2025, exerting downward pressure on international FOB and CFR benchmarks. While other areas experienced volatility tied to India’s tender or China’s export policy, the US Gulf faced a uniquely persistent and structurally driven decline, falling from
USD 394/st at the beginning of the month to
USD 365–370/st by late November.
Persistent Weakness in Domestic Demand
| Factor | Impact on Price |
|---|---|
| Weak farmgate demand | ↓ Downward pressure throughout the month |
| Mild weather / no winter boost | ↓ No seasonal buying |
| High coastal inventories | ↓ Forced selling by importers |
| Sluggish barge activity | ↓ Weak inland pull |
| Global CFR decline (India/Brazil) | ↓ Lower import parity |
| Ample supply from earlier imports | ↓ Prices sagged to monthly lows |
Urea demand at the US farmgate level remained weak throughout November due to mild weather conditions and a lack of winter application pressure. The fertilizer sector did not receive the typical seasonal boost from cold-weather preparations, resulting in unusually slow consumption across central agricultural states. Retail distributors held significant carryover stocks, and field activity remained below seasonal averages.
Logistical Pressure: Low Barge Movement
Reduced barge traffic along the Mississippi and Ohio rivers further limited spot demand. Water levels were stable, but barge utilization was low, reflecting weak fertilizer pull from inland terminals. Traders reported difficulty placing product even at discounted prices, leading to numerous offers lingering without bids.
Inventory Overhang in Coastal Terminal
US importers entered November with substantial inventories following aggressive purchasing earlier in Q3. With no compelling domestic catalyst and weakening global sentiment, wholesalers prioritized inventory liquidation rather than replenishment, pushing spot prices down to clear volumes.
Global Pressure Filtering into the US Gul
The bearish global backdrop amplified local weakness. The Indian tender’s USD 418–420 CFR set a global pricing ceiling, while declining CFR Brazil values and competitive offers from the Persian Gulf and North Africa put additional pressure on NOLA benchmarks. As global netbacks deteriorated, US buyers reduced bids accordingly, knowing that exporters had limited alternative outlets.
By Month-End: US Gulf Became the Lowest-Priced Major Market
By late November, the US Gulf was consistently trading at the lowest global equivalent price, below Brazil CFR and Turkey CFR, and significantly below East Africa CFR. This reinforced its role as a worldwide floor-setter for granular urea values heading into December.
Reference:
USDA AMS – Fertilizer Price Reports
2. AMMONIA MARKET (November 2025)
2.1 Market Overview
Ammonia was the strongest-performing nitrogen product globally in November 2025, registering meaningful price increases in several key markets despite widespread softness across other nitrogen products. Unlike urea—which faced downward pressure from India’s tender and weak demand in Brazil—ammonia benefited from structural supply constraints, elevated feedstock costs, and robust downstream industrial demand
| Region | Mid-Nov | End-Nov | Trend | Comments |
|---|---|---|---|---|
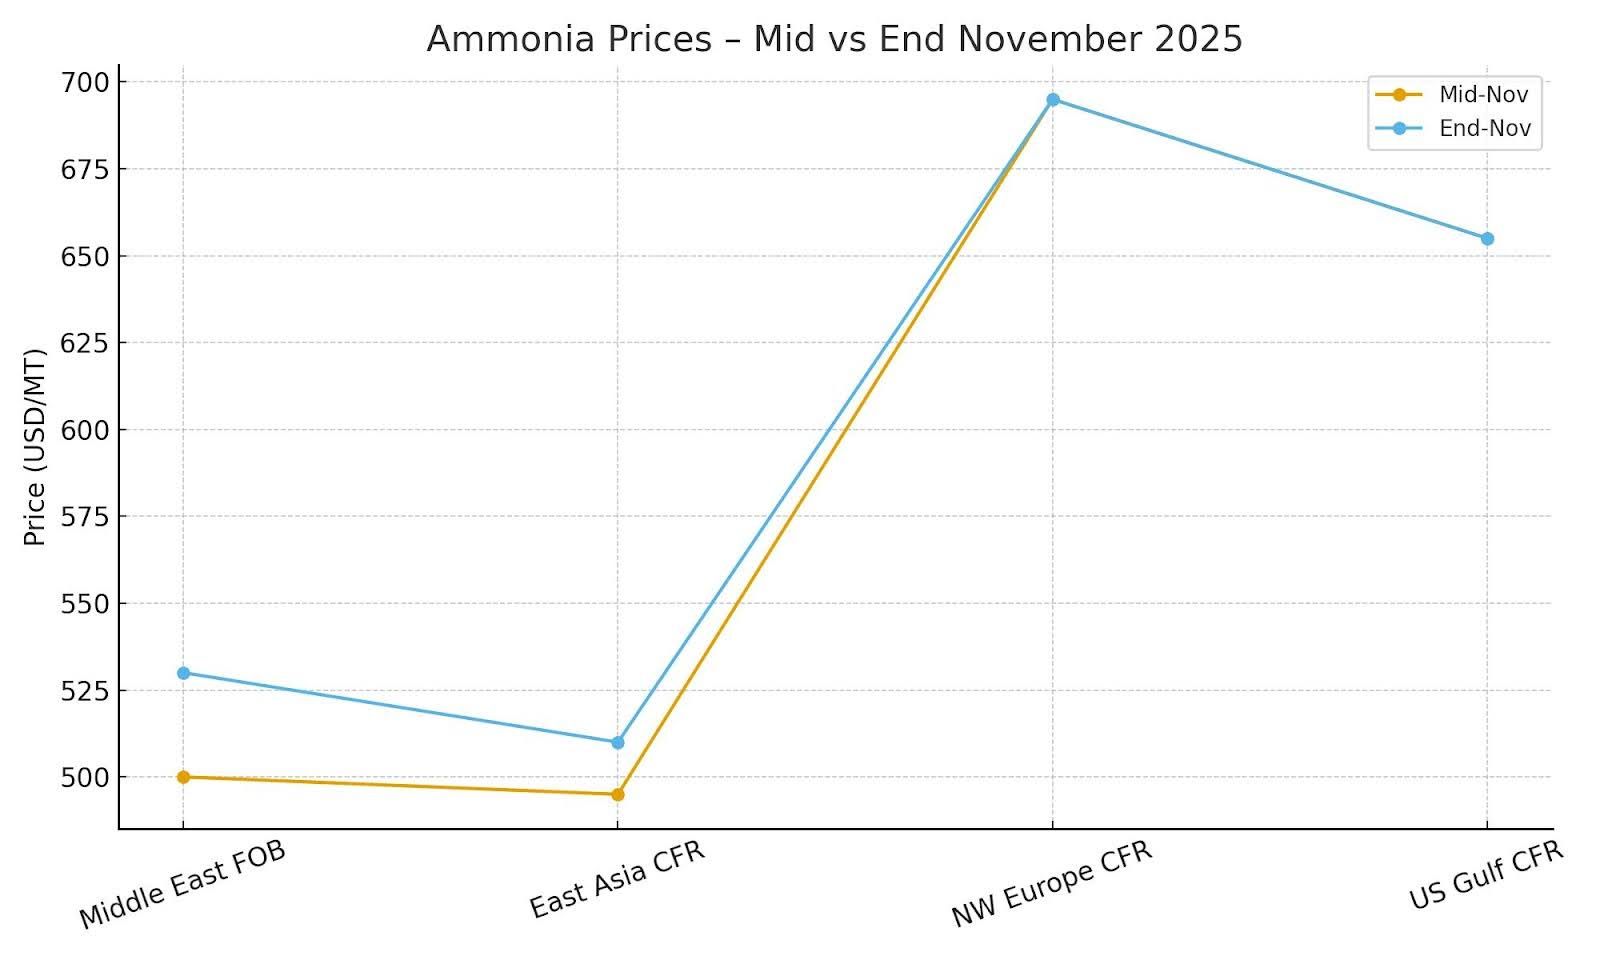
| Middle East FOB | 500 | 530 | ↑ Strong | Supported by global shortage & tight export avails |
| East Asia CFR | 495 | 510 | ↑ | Naphtha costs high; strong downstream demand |
| Northwest Europe CFR | 695 | 695 | → Flat | Stable contracts, low spot liquidity |
| US Gulf CFR | 655 | 655 | → Flat | Market is tight but directionless; limited trading |
The market continued to grapple with the lingering effect of significant production outages in Trinidad, where several ammonia units representing 2.2 million t/year of capacity remained offline. This disruption tightened long-haul availability into the US Gulf, Europe, and parts of Asia, forcing buyers to rely more heavily on Middle Eastern and North African supply.
At the same time, natural gas and naphtha prices remained elevated in parts of Asia, increasing the production costs for domestic ammonia producers and raising the attractiveness of imported volumes. Strong demand from phosphate producers (DAP/MAP) and industrial consumers such as caprolactam plants provided additional support, underpinning firm pricing across East Asia and Europe.
By contrast,
Northwest Europe (CFR 695 USD/MT) and the
US Gulf (CFR 655 USD/MT) showed little movement, held steady by long-term contractual coverage and limited spot transactions. These regions remained structurally tight but stable, with no significant fluctuations in supply or demand during the month.
Overall, ammonia’s performance diverged sharply from other nitrogen commodities, delivering a bullish trajectory that is expected to continue until January 2026, after which planned plant restarts could ease the market.
Reference:
ICIS – Ammonia Market Overview
Market Drivers
1. Trinidad outages (2.2 Mt/y offline): Prolonged downtime in Trinidad—one of the world’s top exporters—tightened global supply and diverted buying pressure toward the Persian Gulf and North Africa.
2. US Gulf supply tightness: Limited arrivals into the US Gulf created pressure on regional pricing fundamentals, keeping CFR values at USD 655, even as global demand increased.
3. High naphtha prices in Asia: Elevated feedstock costs made domestic production in East Asia less competitive, increasing reliance on imports. This helped push CFR East Asia to USD 510 by month-end.
4. Strong downstream demand: Phosphate producers (DAP/MAP) and caprolactam manufacturers maintained high operating rates, keeping ammonia demand healthy even as global nitrogen markets softened.
Outlook
Short-Term (December 2025 – January 2026)
- Market expected to remain bullish
- Supply constraints from Trinidad and the US Gulf limit downside
- Importers likely to secure early 2026 cargoes at elevated levels
Medium-Term (February – March 2026)
- Possible correction as several plants restart
- Chinese downstream demand is uncertain.
- Seasonal slowdown in fertilizer production could reduce ammonia pull.
Key Risks
- Renewed outages in Trinidad, the US Gulf, or North Africa
- Volatility in naphtha and natural gas markets
- Unexpected increases in phosphate demand
3. SULPHUR MARKET (November 2025)
3.1 Expanded Overview
The sulphur market experienced the strongest and most aggressive rally of 2025 in November, outperforming every other fertilizer and petrochemical raw material. Prices surged across all major export and import hubs—particularly into China, Indonesia, and Brazil—driven by a combination of deep supply disruptions, critically low inventories, and accelerating downstream demand from the phosphate industry.
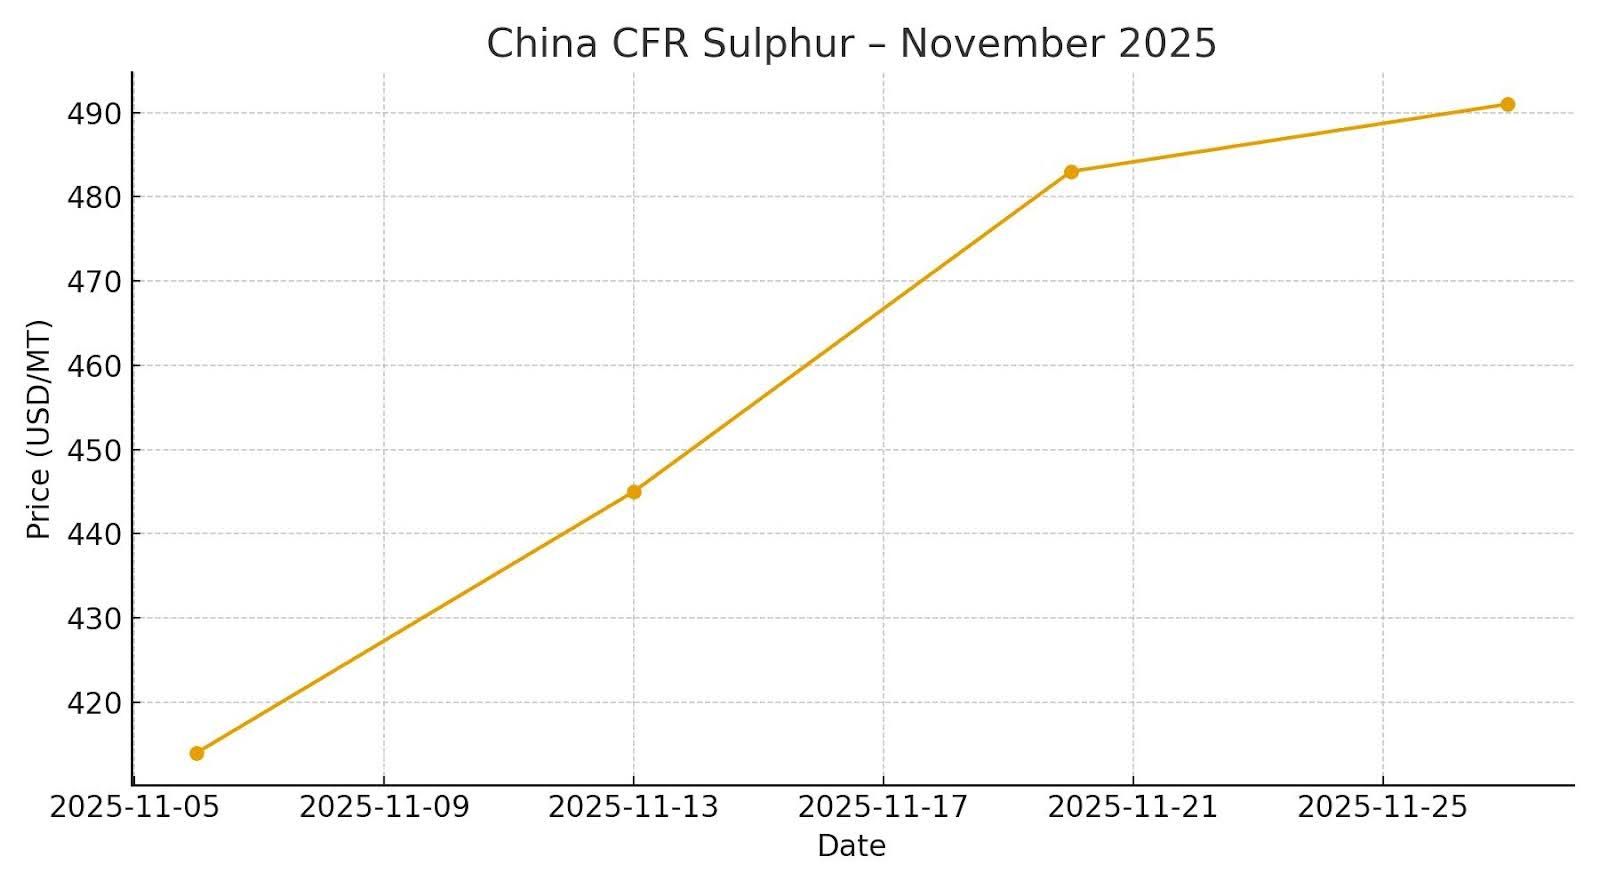
| Date | Price (USD/MT) | Weekly Change | Market Notes |
|---|---|---|---|
| 6 Nov | 410–418 | - | Market enters rally phase; low China stocks |
| 13 Nov | 440–450 | +30–32 | Impact of Russia ban fully priced in |
| 20 Nov | 480–486 | +32–36 | Persian Gulf maintenance tightens supply |
| 27 Nov | 490–492 | +6–10 | Rally slows but remains bullish |
China CFR Sulphur (USD/MT)
The most influential driver was Russia’s ongoing sulphur export ban, which continued to remove a primary supply source from the global seaborne market. Russia typically ships sizeable volumes into China, Morocco, and India; the sudden absence of these tons created persistent tightness, forcing importers to rely more heavily on Middle Eastern and North African suppliers.
Compounding this supply shock, several Persian Gulf producers entered maintenance cycles, tightening spot Sulphur and sulphuric acid availability at a time when Chinese and Southeast Asian buyers were restocking ahead of Q1 2026. This regional constraint limited FOB availability from key exporters, including Saudi Arabia, Qatar, and the UAE, putting upward pressure on physical spot prices.
China, the world’s largest Sulphur importer, entered November with exceptionally low port inventories. This magnified the impact of supply disruptions: buyers moved aggressively to secure spot cargoes, bidding up CFR values week after week. At the same time, Indonesian smelters and fertilizer producers faced surging sulphuric acid costs, reinforcing regional demand for elemental Sulphur and further tightening the Pacific Basin market.
By late November, with freight tightening on key Middle East-to-China routes and no meaningful relief from Russia or Europe, the bullish momentum remained intact. Sulphur became the strongest commodity within the global fertilizer value chain, rising faster than ammonia, urea, or phosphates during the same period.
Reference:
TradingView – Global Sulphur Prices
Market Drivers
1. Russia’s Sulphur Export Ban
Russia—usually a major sulphur supplier to China, Morocco, Turkey, and Brazil—maintained its complete export halt throughout November. The resulting gap drove Chinese buyers into aggressive bidding wars, particularly on prompt-load Persian Gulf cargoes.
2. Persian Gulf Maintenance
Key sulphur export terminals across the Persian Gulf underwent planned and unplanned maintenance. Limited availability of molten sulphur tightened the global sulphur-sulphuric acid balance, pushing FOB prices higher.
3. Critically Low Chinese Inventories
Chinese port stocks fell to multi-year lows before November began. Combined with steady downstream fertilizer and metal-processing demand, this created a structurally tight import requirement.
4. High Sulphuric Acid Prices in Indonesia
Smelters in Indonesia saw higher sulphuric acid costs due to supply disruptions and more vigorous mining activity, leading to increased consumption of imported sulphur.
5. Freight Tightness on ME → China Route
Spot freight rates into China remained firm due to vessel shortages and active demand from both fertilizer and metal-processing buyers.
Outlook – December 2025 / Early 2026
Short-Term Outlook (December)
- Prices expected to remain firm due to persistent supply tightness
- China continues restocking
- No immediate return of Russian tons
Medium-Term Outlook (Q1 2026)
Potential for correction in late January if:
- Persian Gulf production returns to normal
- China slows restocking after Spring Festival.
- Sulphuric acid prices ease
Upside Risks
- Prolonged maintenance in the Persian Gulf
- Further disruption in Russia
- Freight spikes into China or Southeast Asia
4. PHOSPHATES MARKET (November 2025)
4.1 Expanded Market Overview
The global phosphate market—particularly DAP and MAP—remained decisively bearish throughout November 2025, in stark contrast to the strong price rallies seen in sulphur and ammonia. Importers in almost all major regions adopted a defensive purchasing posture, delaying procurement in anticipation of lower Q1 2026 prices. At the same time, supply availability from China, North Africa, and the United States remained adequate relative to subdued demand, reinforcing a stable-to-soft trading environment.
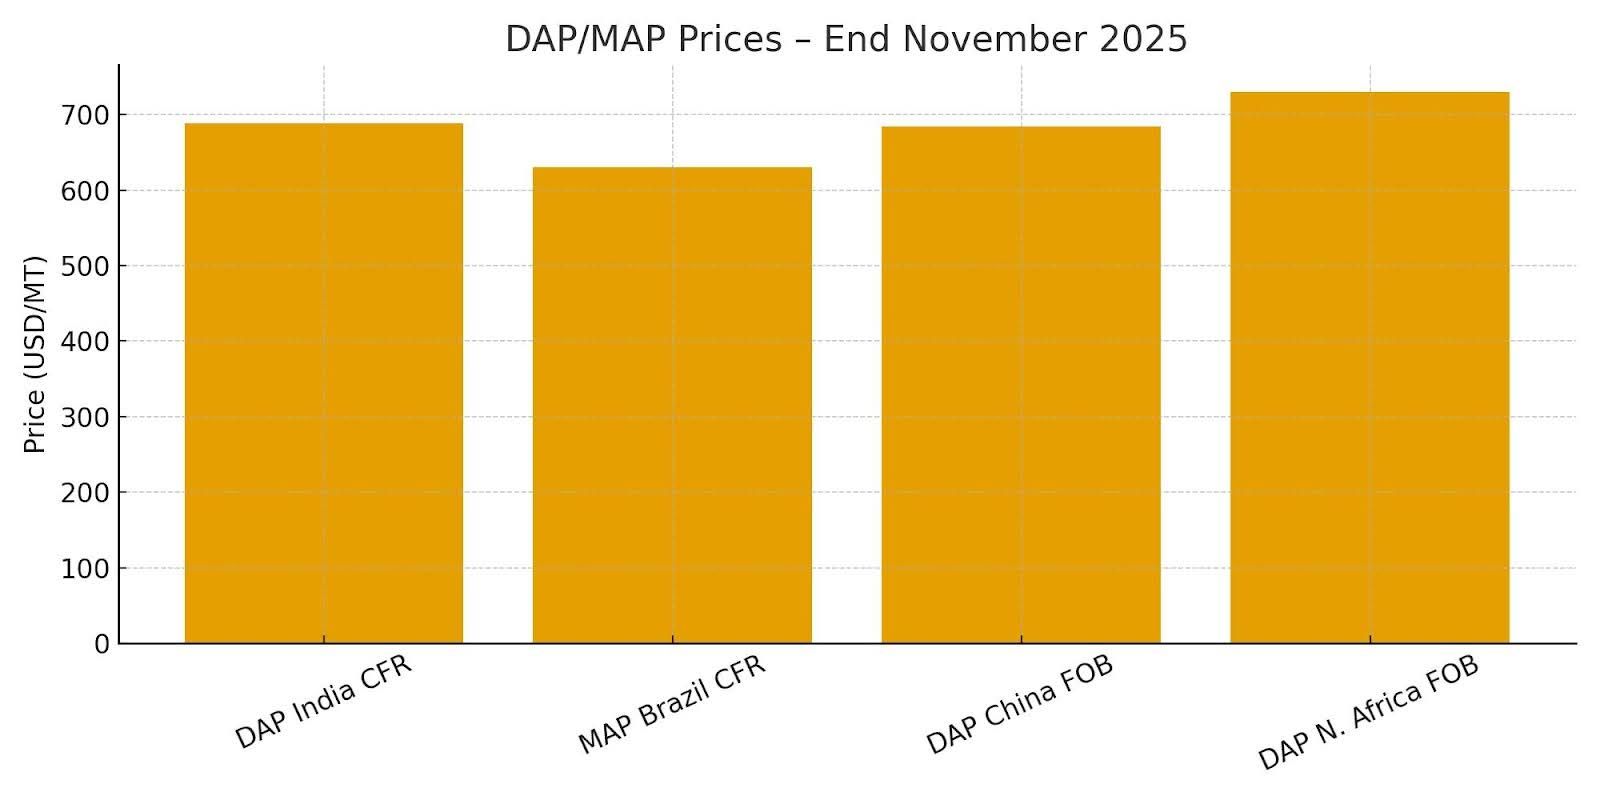
| Region | Price (USD/MT) | WoW | Trend | Market Commentary |
|---|---|---|---|---|
| DAP India CFR | 688–689 | ↓ 10 | Bearish | Post-Kharif slowdown; importers wait for subsidy clarity |
| MAP Brazil CFR | 630 | → Flat | Weak | Buyers delaying ahead of expected Q1 declines |
| DAP China FOB | 680–690 | → | Stable | Strong domestic demand; restricted exports |
| DAP North Africa FOB | 720–740 | ↑ Slight | Mildly firm | Supported by European & African demand |
In India, fresh DAP demand remained limited following the post-Kharif slowdown, with importers in no rush to replenish stocks. Domestically produced phosphatic fertilizers continued to meet much of the near-term demand, reducing appetite for CFR purchases. Meanwhile, clarity on government subsidies—typically a driver of tender activity—did not materialize in November, further delaying activity.
Brazilian MAP buyer followed a wait-and-see approach throughout the month. Despite stable agricultural fundamentals, the combination of weaker currency conditions, lower crop margins, and high carryover stocks discouraged new buying. This prevented any upward price movement and held MAP stable at
USD 630 CFR by month-end.
sInChina, DAP exports remained within controlled limits, yet FOB prices held steady at
USD 680–690, supported by solid domestic consumption and seasonal winter stocking. Even though export availability was not abundant, global demand weakness prevented FOB values from rising meaningfully.
North Afric (Morocco, Tunisia, and Egypt) showed a mild firmness in FOB values (USD 720–740) driven by steady long-term commitments to Europe, sub-Saharan Africa, and South Asia. However, even this region struggled to boost prices beyond modest week-on-week gains due to subdued global appetite.
aOverall, November was characterized bylow liquidity,
delayed purchasing, and widespread expectations of
cheaper Q1 2026 prices, leaving the phosphate market soft but stable.
Reference:
FAO – Phosphate Fertilizer Market Briefing
4.2 Key Market Drivers
1. Lower Demand in India Post-Kharif:
The end of the Kharif planting season significantly reduced India’s appetite for imported DAP. Producers and importers focused on domestic supply and subsidy alignment rather than fresh CFR purchases.
2. Brazilian Importers Delaying Q1 Buyers:
Stable MAP prices and weak liquidity reflected expectations of cheaper Q1 2026 offers.
Currency volatility (BRL depreciation) and high carryover stocks added caution.
3. US Market Weakness Following Tariff Adjustments:
Changes in trade policy and tariff structures disrupted import flows into the US, reducing spot liquidity and dampening CFR demand.
4. Stable Supply From China and North Africa: Neither region faced major production bottlenecks. As a result, steady availability combined with weak global demand reinforced a pricing ceiling.
4.3 Outlook for December 2025 & Q1 2026
Short-Term (December)
- Global DAP/MAP prices expected to remain soft
- India is unlikely to issue large tenders
- Brazil continues to buy hand-to-mouth
Medium-Term (Q1 2026)
- Potential for mild price recovery if Indian demand reactivates
- African campaigns (Ethiopia, Kenya) may provide regional support
- The Chinese export policy will determine price floors
Potential Upside Risks
- Delays in Chinese export clearances
- Supply disruptions in North Africa
- Unexpected subsidy announcements in India
5. FREIGHT MARKET (Urea) – November 2025
5.1 Overview
Global urea freight markets in November 2025 displayed significant regional divergence, shaped by vessel scarcity in the Atlantic, seasonal tightness in the Baltic, and normalized rates across Asia. Freight costs exerted a strong influence on CFR price formation—particularly in Brazil and the US Gulf, where long-haul freight can account for 8–15% of the landed cost of granular urea.
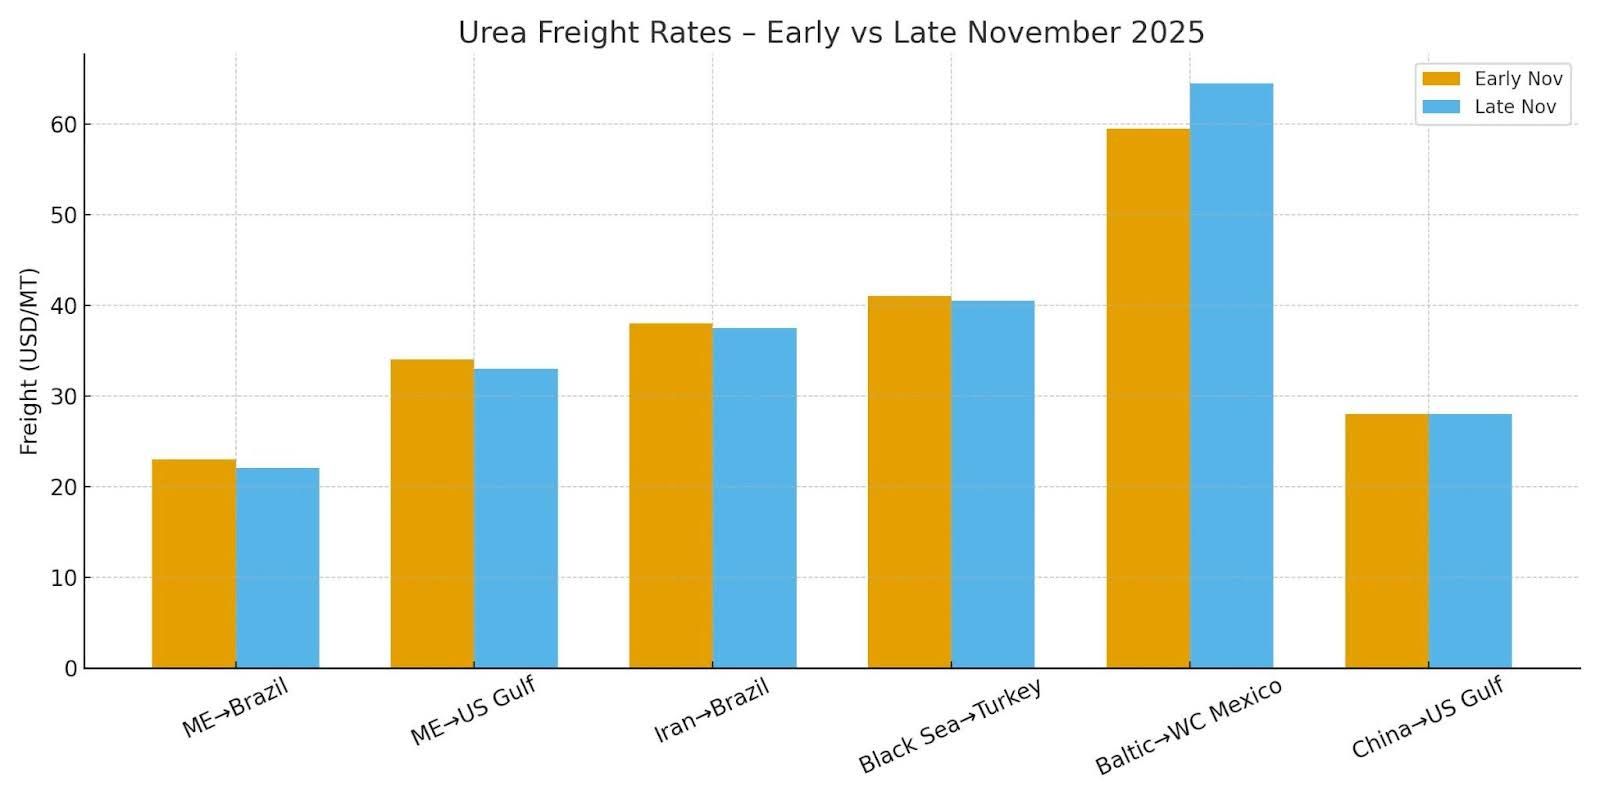
| Route | Early Nov | Late Nov | Trend | Commentary |
|---|---|---|---|---|
| Persian Gulf → Brazil | 22-24 | 21-23 | ↓ Slight | Mild softening as vessel availability improves |
| Persian Gulf → US Gulf | 33-35 | 32-34 | ↓ Slight | Seasonal easing; improved fleet rotation |
| Iran → Brazil | 36-40 | 36-39 | → Stable | High due to sanctions premiums & owner reluctance |
| Black Sea → Turkey | 40-42 | 40-41 | → Stable | War-risk premiums keep rates elevated |
| Baltic → WC Mexico | 54-65 | 62-67 | ↑ Strong | Winter tightness; fewer vessels in high-risk waters |
| China → US Gulf | 27-29 | 27-29 | → Stable | Strong vessel supply keeps rates steady |
The Persian Gulf → Brazil and Persian Gulf → US Gulf routes softened slightly through the month on improving vessel availability. However, gains in the Baltic were significant, as winter weather tightened tonnage and raised rates for long-haul voyages to Mexico and the Americas. Meanwhile, Iranian freight remained structurally elevated due to sanctions-linked premiums and limited owner willingness.
The
Black Sea maintained firm freight levels amid ongoing geopolitical instability and higher war-risk insurance, keeping exports to Turkey and the Mediterranean at elevated levels despite stable vessel activity.
In Asia, the
China → US Gulf route remained one of the most competitively priced long-haul routes globally, reflecting an abundance of available vessels and consistent chartering activity driven by export markets.
Overall, November freight conditions reinforced bearish CFR benchmarks in Brazil and the United States, while simultaneously tightening differential spreads in the Atlantic Basin.
5.2 Regional Freight Analysis
1. Persian Gulf → Brazil & US Gul
Freight rates softened marginally due to increased tonnage availability, driven by seasonal repositioning of vessels after October’s peak chartering period. Rates eased by 1–2 USD/MT, helping reduce CFR Brazil and CFR US Gulf values slightly.
Impact: Improved netbacks for exporters; bearish signal for import markets.
2. Iran → Brazil
Rates remained elevated at 36–39 USD/MT, driven by sanctions-related risk premia, limited vessel availability, and additional insurance surcharges. Despite Iran’s competitive FOB pricing, freight differentials continued to erode its attractiveness relative to Persian Gulf origins.
Impact: Iran FOB advantage partially canceled by freight overhead.
3. Black Sea → Turkey
Rates held stable at 40–41 USD/MT, reflecting ongoing geopolitical uncertainty and persistent war-risk premiums. Although distances are short, additional risk fees prevent any meaningful softening.
Impact: Turkish CFR levels remain structurally higher than ME-origin alternatives.
4. Baltic → West Coast Mexico
Winter ice conditions and vessel rerouting contributed to the most substantial global freight increase. Rates rose from 54–65 → 62–67 USD/MT, driven by limited vessel supply and seasonal Atlantic tightness.
Impact: MAP, DAP, and urea exporters from Northern Europe face reduced long-haul competitiveness.
5. China → US Gul
One of the few routes globally with stable freight throughout November, supported by balanced vessel availability and consistent export activity out of Chinese ports. Rates held at 27–29 USD/MT for the entire month.
Impact: Chinese prilled urea maintained a competitive landed cost in the Americas.
5.3 Freight Tightness Index
fVery Tight → █████ (Baltic)
Tight → ████░ (Iran, Black Sea)
Moderate → ███░░ (Persian Gulf)
Loose → ██░░░ (China)
5.4 Outlook – December 2025 & Early 2026
Short-Term (December)
- Atlantic Basin freight is likely to tighten further due to the holidays
- Persian Gulf rates expected to remain stable to slightly firmer
- China and SE Asia routes remain
well-supplied
Medium-Term (Q1 2026)
- Seasonal easing expected post-January
- Freight may soften if Brazil and India reduce spot inquiries
- Baltic routes to normalize after ice-class fleet reallocation
6. PETROCHEMICAL MARKET OVERVIEW
A combination of energy price volatility, regional oversupply, and divergent demand cycles across Asia, Europe, and the Middle East shaped the global petrochemical market in November 2025. At the same time, specific polymer and aromatics segments experienced modest recovery, others—such as methanol and glycols—faced pressure from weak derivative margins and high feedstock costs
Below is a detailed breakdown of the major petrochemical segments relevant to fertilizer and industrial consumers.
6.1 Methanol – Soft Market Despite Energy Support
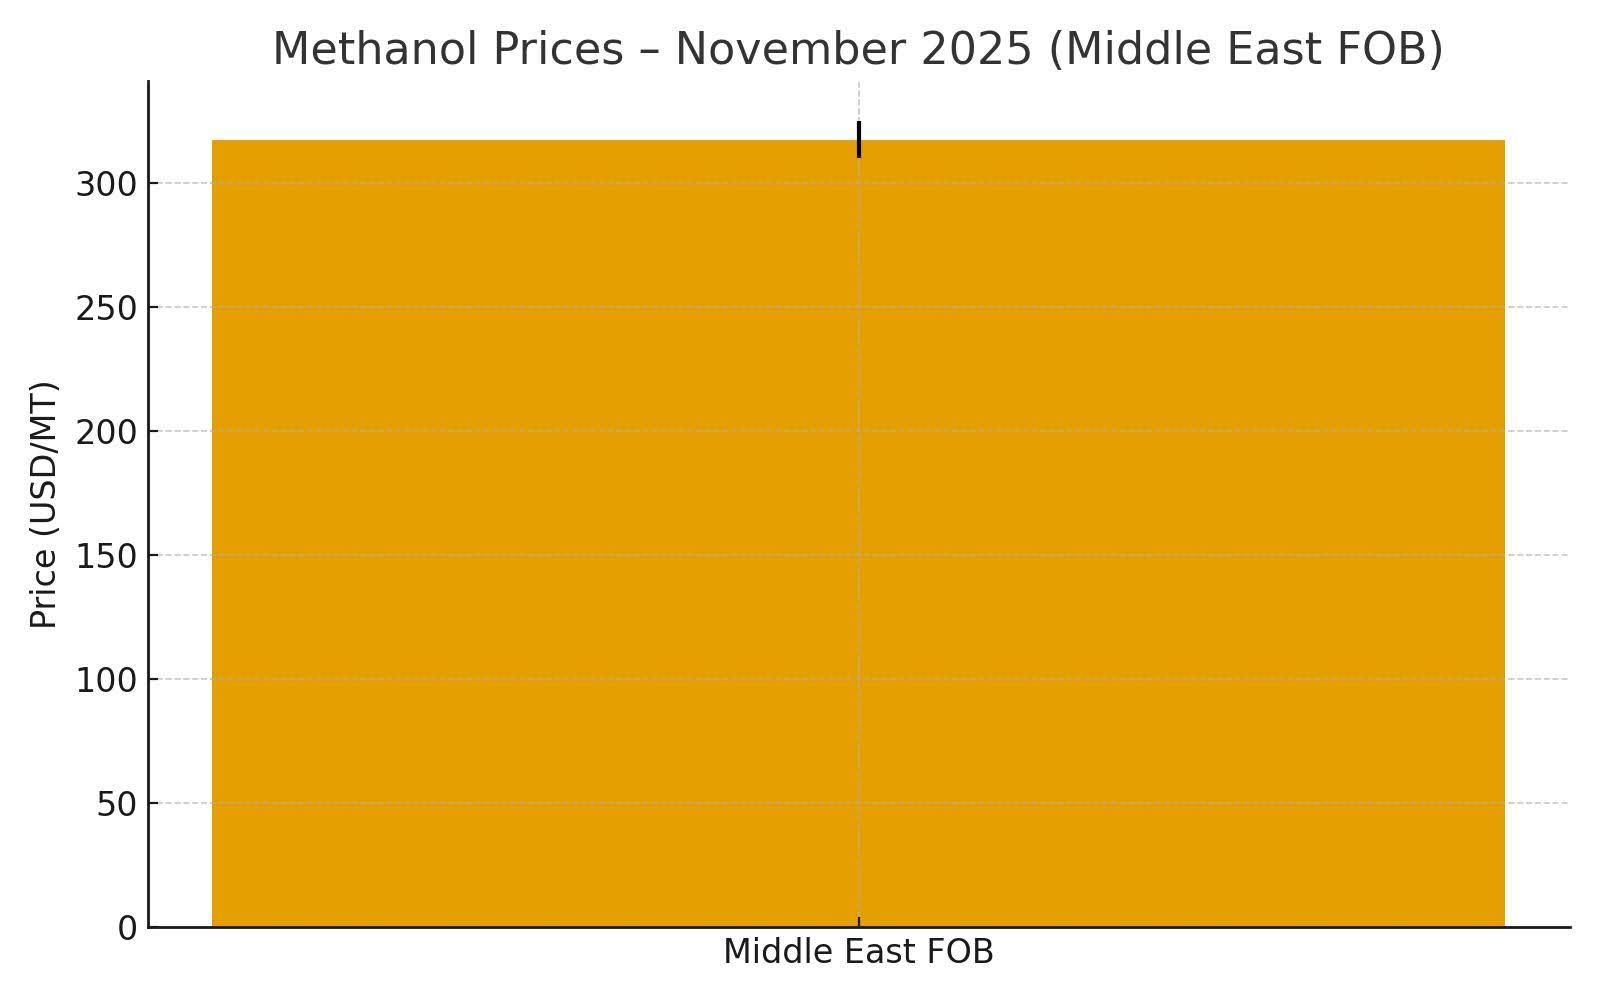
Methanol prices in November were characterized by sideways–to–soft movement, with Middle East FOB assessments holding at:
- 310–325 USD/MT (FOB Middle East)
- China CFR remained under pressure as MTO (Methanol-to-Olefins) margins stayed profoundly negative, discouraging spot purchases and lowering run rates at several independent MTO units.
| Region | Price (USD/MT) | Trend | Market Commentary |
|---|---|---|---|
| Middle East FOB | 310–325 | → Soft | Limited upside due to China's weakness |
| China CFR | Weak | ↓ | MTO margins are negative; buying is limited |
| Europe | Stable | → | Supported by MTBE demand |
Despite the pressure in Asia, freight stability and consistent demand from formaldehyde, MTBE, and acetic acid producers provided some support, preventing a more profound decline.
Key Drivers
- Weak MTO margins: Chinese MTO producers operated at reduced rates, limiting CFR demand.
- Stable methanol consumption in non-MTO derivatives: MTBE and resins supported base demand.
- Steady freight rates: ME → China freight stability helped maintain FOB export competitiveness.
- Middle East production steady: No major shutdowns kept supply stable.
Reference: ICIS Methanol Price Index
6.2 Polyethylene (PE) – Mixed Regional Trends
| Region | Trend | Commentary |
|---|---|---|
| Europe | ↑ Slight | Cost-driven support despite weak consumption |
| GCC | → Stable | Healthy domestic/nearby regional demand |
| India | → Stable | Regular seasonal orders from converters |
| China | ↓ Weak | Oversupply + soft downstream sector |
The polyethylene market (HDPE/LDPE/LLDPE) showed a divergent regional performance in November:
Europe: Slight Uptrend
European PE prices strengthened modestly due to:
- Higher naphtha/crude input costs
- Lower local production from energy-related slowdowns
- Firmer import parity due to shipping congestion in the Atlantic
GCC & India: Stable Demand
The GCC and Indian markets saw healthy demand despite global softness, supported by:
- Consistent packaging and film consumption
- Steady export volumes to Africa and South Asia
China: Oversupply Capping Upside
- China’s domestic oversupply—driven by new petrochemical complex startups—restricted PE price increases even when crude oil strengthened.
- Local inventories remained high, keeping CFR parity capped.
Reference:
Platts – Global Polyolefins Report
6.3 Aromatics – Divergent Movements Across the Chain
| Product | Trend | Market Commentary |
|---|---|---|
| Benzene | ↑ Firm | Supported by crude oil and styrene demand |
| Paraxylene (PX) | → Stable | Balanced PTA supply-demand |
| Toluene | ↓ Weak | Slow solvents & TDI consumption |
Aromatics displayed clear divergence across the chain:
Benzene – Bullis
- Benzene prices strengthened alongside higher crude oil benchmarks.
- Improved styrene margins also supported benzene consumption.
Paraxylene (PX) – Stabl
- PX remained range-bound due to balanced PTA demand in China and stable PX production operations in Northeast Asia.
Toluene – Wea
Toluene softened due to:
- Slow demand from TDI producers
- Reduced solvent consumption
- Oversupply in parts of Southeast Asia
Reference:
Argus Aromatics Monthly Outlook
6.4 Combined Visual – Petrochemicals Trend Map
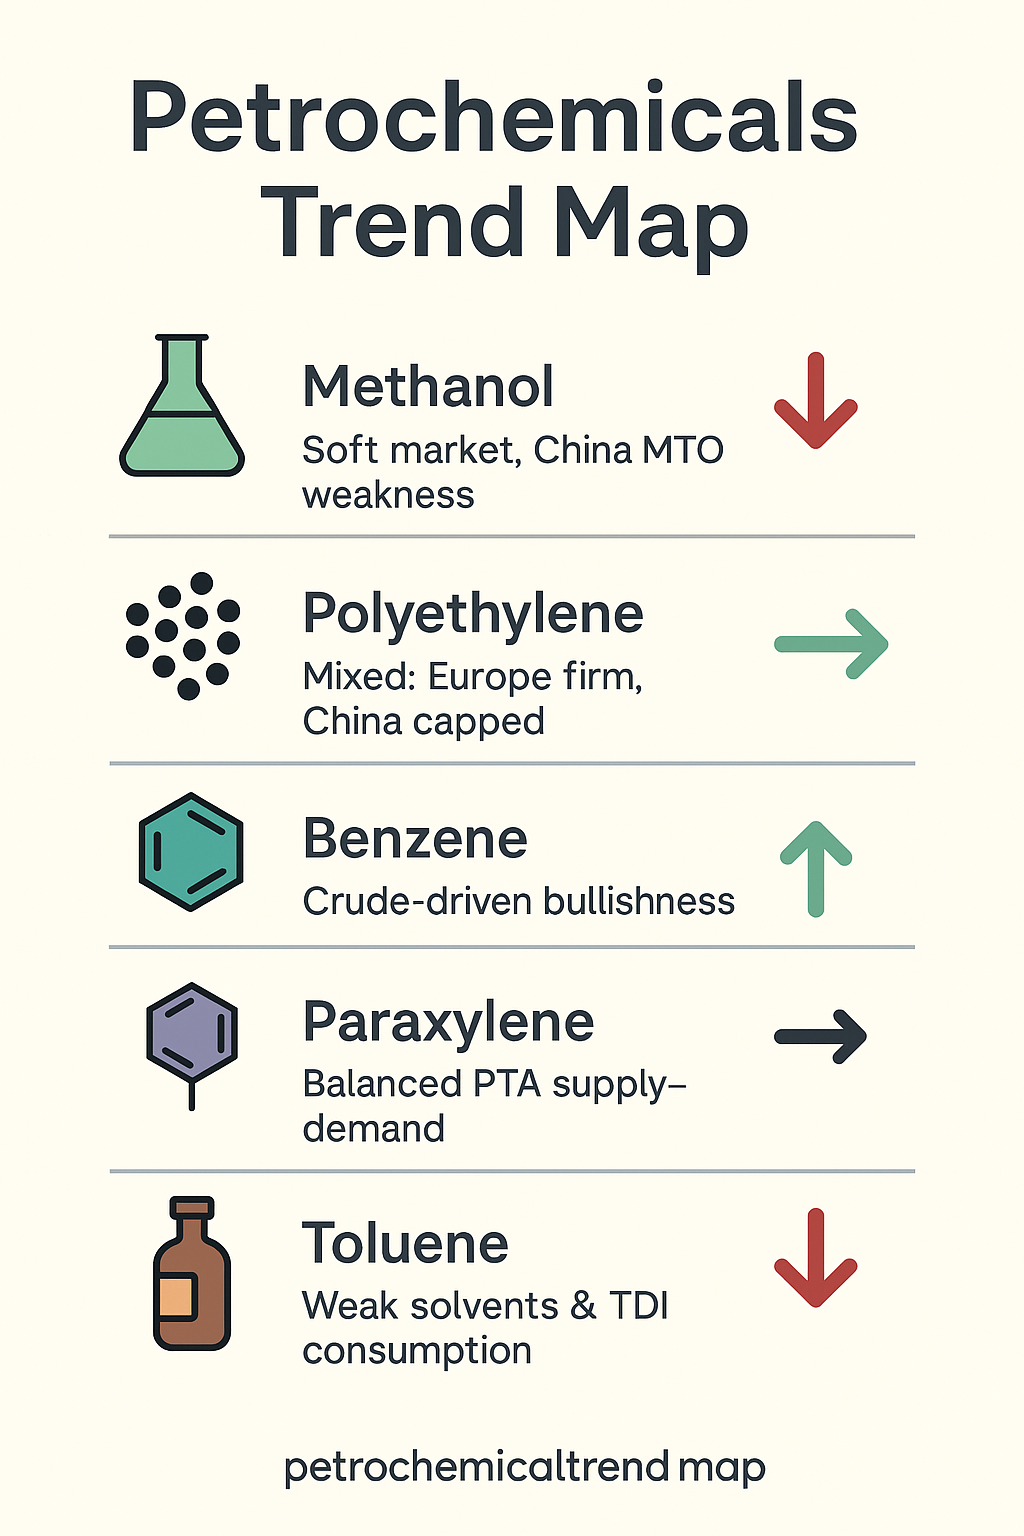
Short-Term (December)
- Methanol is likely to remain soft due to China's MTO weakness
- PE to stay regionally mixed; Europe may see slight strength.
- Benzene is expected to track crude oil movements.
- PX stable; toluene weak
Medium-Term (Q1 2026)
- New petrochemical capacity in China may keep polyolefins capped
- Benzene–styrene chain may strengthen with higher run rates
- Methanol may rebound if MTO margins improve or coal prices fall.
7. MARKET OUTLOOK – December 2025 & Q1 2026
| Segment | Outlook | Notes |
|---|---|---|
| Urea | ↓ Bearish (Dec) / Volatile (Q1) | India tender sets ceiling; China exports uncertain |
| Ammonia | ↑ Strong to Jan / ↓ Correction Feb | Supply restarts expected |
| Sulphur | ↓ Correction coming | Rally overextended |
| Phosphates | ↔ Stabilizing early Q1 | India & Brazil demand are recovering |
| Freight | ↔ Tight December | Normalizing into Q1 |
7.1 Urea Outlook – Bearish for December, Volatile for Q1 2026
The global urea market is positioning for another period of softness heading into December.
With the India IPL tender in November setting a ceiling at USD 418–420 CFR, exporters across the Persian Gulf, China, and North Africa are expected to reduce their offers further to maintain competitiveness.
Key Market Signals
- Global downtrend continues: Middle East FOB could test the USD 390–398 range in early December.
- Brazil buyers remain sidelined: Importers are delaying purchases and waiting for lower freight + lower CFR values, keeping demand very thin.
- SE Asia cautious: Indonesia, Vietnam, and Thailand are largely hand-to-mouth, preferring January cargoes.
- China’s export policy remains the wild card:
If Beijing releases an additional quota, it will cap global prices; if not, FOB China may stabilize near USD 400–405.
Q1 2026 Expectation
India is highly likely to issue another strategic tender in late February / early March, which will temporarily support global prices. However, any rally is expected to be short-lived unless China restricts exports.
7.2 Ammonia Outlook – Strong Through January, Correction in February–March
Ammonia is poised to remain the strongest nitrogen product through January 2026, driven by structural shortages and strong downstream demand.
Key Bullish Factors (Dec–Jan)
- Trinidad supply outages continue to limit global availability.
- Tight US Gulf market persists as restocking demand intersects with refinery maintenance cycles.
- Asia’s high naphtha costs keep ammonia economically attractive for some chemical producers.
- Caprolactam, acrylonitrile, and phosphate producers continue to operate at high utilization rates.
Expected Turning Point – February 2026
- Multiple plants in the Middle East, Malaysia, and Trinidad are scheduled to return online.
- Additional availability should cool prices, possibly pulling Middle East FOB from
USD 520–530 → USD 480–500 by March.
Conclusion:
Strong until January → Controlled correction in February/March.
7.3 Sulphur Outlook – Rally Nearing Exhaustion
Sulphur recorded one of its sharpest rallies of the year in November, but the market is showing increasing stress on the demand side.
What to Expect in December
- Affordability becomes a key constraint: Chinese buyers are already rationing higher-priced cargoes above USD 490–500 CFR.
- Spot demand slows: Many importers have covered near-term needs during the November surge.
- Middle East maintenance easing:
As more supply becomes available, pressure on FOB values should relieve.
December–January Projection
CFR China is likely to correct into the USD 455–470 range by mid-December, with the possibility of further easing if sulphuric acid prices weaken in SE Asia.
Conclusion:
Rally is peaking → correction expected within weeks.
7.4 Phosphates Outlook – Stabilization Expected in Early Q1 2026
The phosphates market (DAP/MAP/TSP) is in a bearish but stabilizing phase.
The late-2025 weakness is driven by delayed purchasing in major importing regions, but structural fundamentals remain stable.
India
- Post-Kharif buying returned slowly in December.
- DAP CFR could stabilize around
USD 690–700 into early January.
Brazil
- MAP CFR stabilizing near USD 620–640, supported by preparations for the Safrinha season.
- Inventory levels remain manageable, preventing any sharp declines.
US Market
- Weakness from tariff adjustments continues to pressure domestic distributors.
- Import volumes remain low as buyers expect cheaper global offers.
Conclusion:
Soft through December → Mild recovery expected in January–February.
7.5 Freight Market Outlook – Tight Through the Holidays
Freight dynamics remain a significant variable for all fertilizer trade flows, especially given the historically tight tonnage supply in Q4.
What Drives December Tightness
- Holiday-season crew/staff shortages
- Limited vessel availability for smaller parcels (25–45 kt)
- Higher demand for clean product tankers in petrochemicals
Route-Specific Outlook
- Baltic routes remain elevated due to winter navigation costs and tight supply.
- Persian Gulf routes may soften slightly as demand pauses after India’s November tender.
- China freight remains relatively stable, supported by steady outbound shipments and affordable bunker prices.
Q1 2026 Projection
- Freight should ease gradually as vessel supply normalizes post-holidays.
- However, geopolitical risks and winter weather may still cause week-to-week volatility.
8. Conclusion
November 2025 was one of the most strategically significant months for the global fertilizer and petrochemical complex, reshaping price expectations across all major product groups. The decisive outcome of India’s urea tender, combined with China’s controlled export posture and weakening demand in Brazil, created a clear downward trajectory for urea and phosphates. At the same time, structural shortages of ammonia and the extraordinary rally in Sulphur demonstrated that nitrogen- and Sulphur-based value chains remain highly sensitive to supply outages and geopolitical constraints.
Across most markets, the prevailing theme was dislocation between producer expectations and buyer sentiment. Importers in Brazil, Southeast Asia, and Europe displayed disciplined purchasing behavior, often delaying cargo commitments in anticipation of lower prices. Meanwhile, producers in the Persian Gulf, North Africa, and China were forced to adjust offers more aggressively, aligning FOB values with tighter netbacks and weaker global CFR benchmarks.
In parallel, the petrochemical sector delivered mixed performances: methanol and aromatics responded directly to energy price movements. At the same time, polyethylene markets diverged regionally due to contrasting supply–demand balances in Europe and China. Freight markets, although stabilizing slightly, remained structurally tight, reminding the industry that logistics constraints continue to influence landed fertilizer costs as much as commodity fundamentals
Looking ahead to December and Q1 2026, the industry enters a period of measured caution. Urea is expected to remain soft until India re-enters the market, ammonia is likely to stay elevated until plant restarts in early Q2, sulphur appears poised for a correction after an unusually sharp rally, and phosphates are nearing a point of stabilization driven by India’s seasonal buying and Brazil’s pre-Safrinha preparations. Freight markets will remain tight through year-end before normalizing gradually in early 2026.
Overall, November reinforced a central truth for global fertilizer and petrochemical stakeholders
In a market defined by supply disruptions, shifting tender dynamics, and regional demand asymmetry, agility and timing remain the most valuable strategic assets.
REFERENCES
1.Fertilizer & Commodity Organization
- International Fertilizer Association (IFA)
- World Bank – Commodity Price Data
- FAO Fertilizer Statistics Database
- UN Comtrade – Global Trade Data
- World Trade Organization (WTO) – Market Data & Reports
2. Market Data Platforms & Pricing Benchmarks
- Trading Economics – Urea & Fertilizer Commodity Prices
- Baltic Exchange – Freight Indices (BDI)
- ICIS (Public Fertilizer & Chemical Market Updates)
3. Proprietary Industry Sources